 POLICY
POLICY
POLICY
POLICY
The financial services industry has always been a leading consumer of tech with big information technology budgets. The recent banking crisis will add even more headwinds to the already challenging IT spending climate and several tech firms are exposed.
In particular, we believe those companies with a higher-than-average mix of business in financial sectors, combined with decelerating spending momentum on their platforms, will face increased headwinds in the coming months as banks tighten budgets. Our initial research shows two ends of the spectrum. Splunk Inc., Dynatrace Inc., SailPoint Technologies Inc., Informatica Inc., DocuSign Inc. and Zoom Video Communications Inc., along with several other firms, appear to be more negatively exposed. On the other hand, Workday Inc., Databricks Inc., Confluent Inc., Hashicorp and some other names have accelerating sequential momentum within the financial services industry.
In this Breaking Analysis we squint through the myriad data points and try to answer the question: Which tech companies are most exposed to the banking crisis? We’ll review how we got to this point in history and what it means for tech. We’ll then dig into the Enterprise Technology Research data and try to highlight which companies are most likely to feel the pinch, which firms appear to face minimal impacts, and those names that are actually accelerating in the financial services sector.
We all know the story.
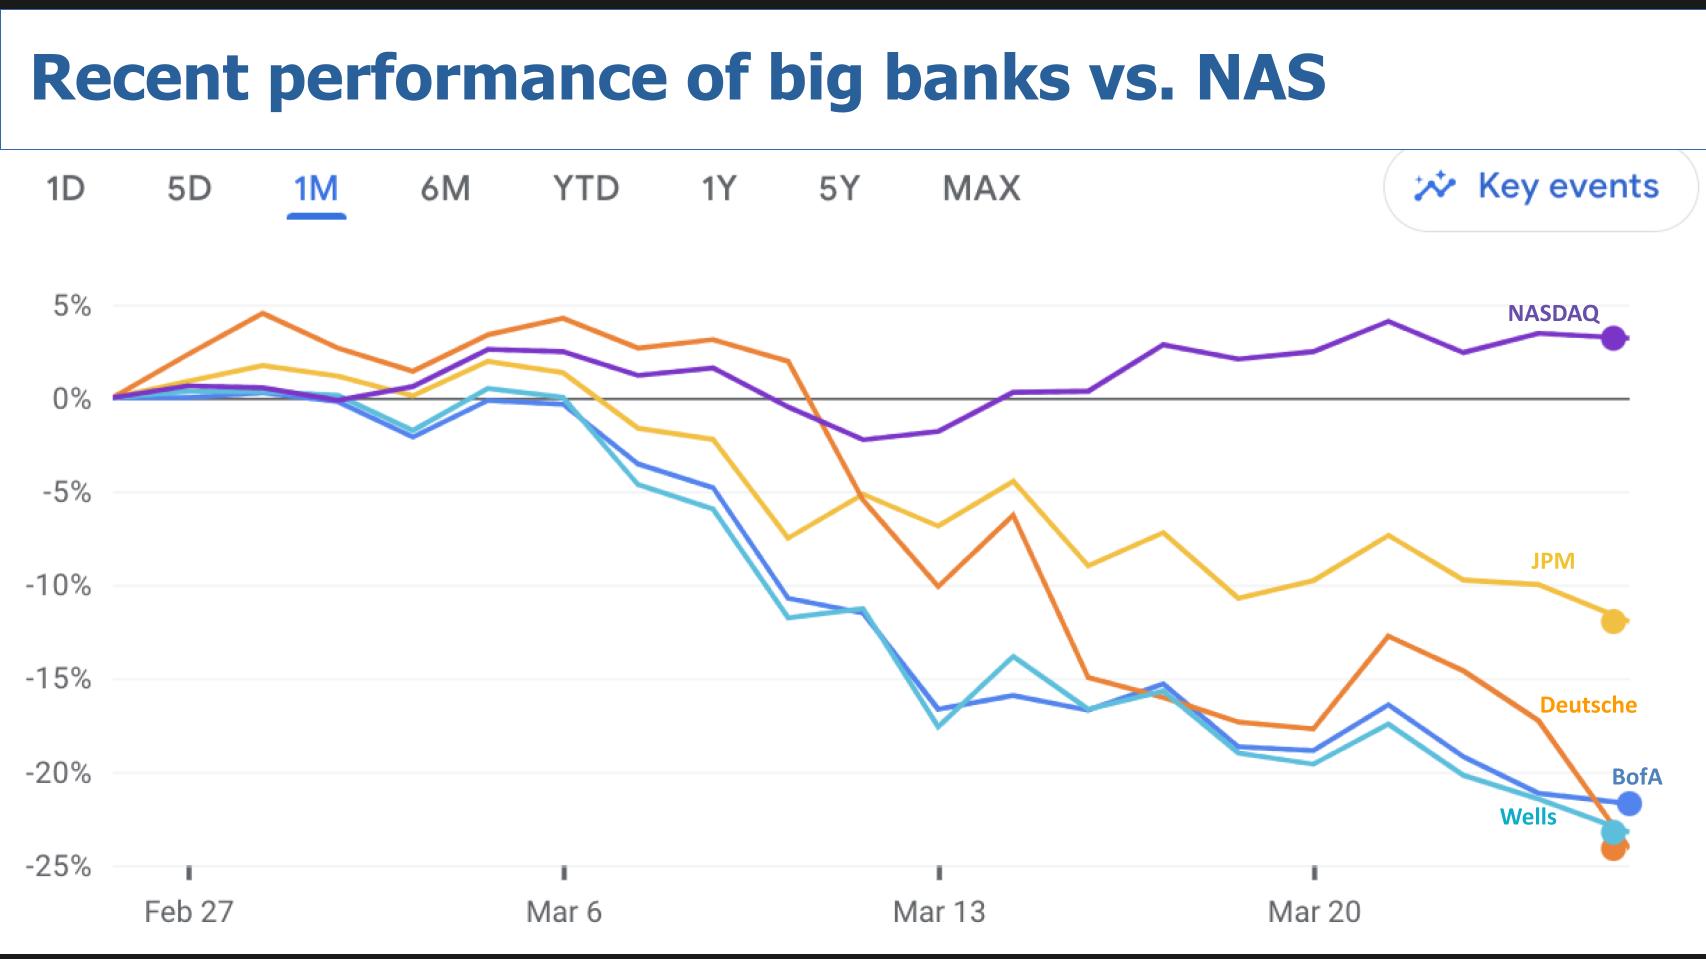
All the banks are off in sympathy to the crisis of confidence that’s occurring. Most big bank stocks are off 20% or more in the past month, JPMorgan Chase & Co. is the exception – it’s off low double digits. We didn’t put First Republic on the chart above because it’s off almost 90% this month and it would scrunch everything together. But the Nasdaq is up in the past 30 days because investors are flipping out of banks and into tech on the bet that the Federal Reserve will actually begin to loosen its grip on interest rates this year. This has especially benefited large cap tech stocks that have broad industry exposure and lots of cash and perhaps were oversold.
The picture in the banking sector as you know has been U-G-L-Y and maddening for observers, depositors, startups and investors.
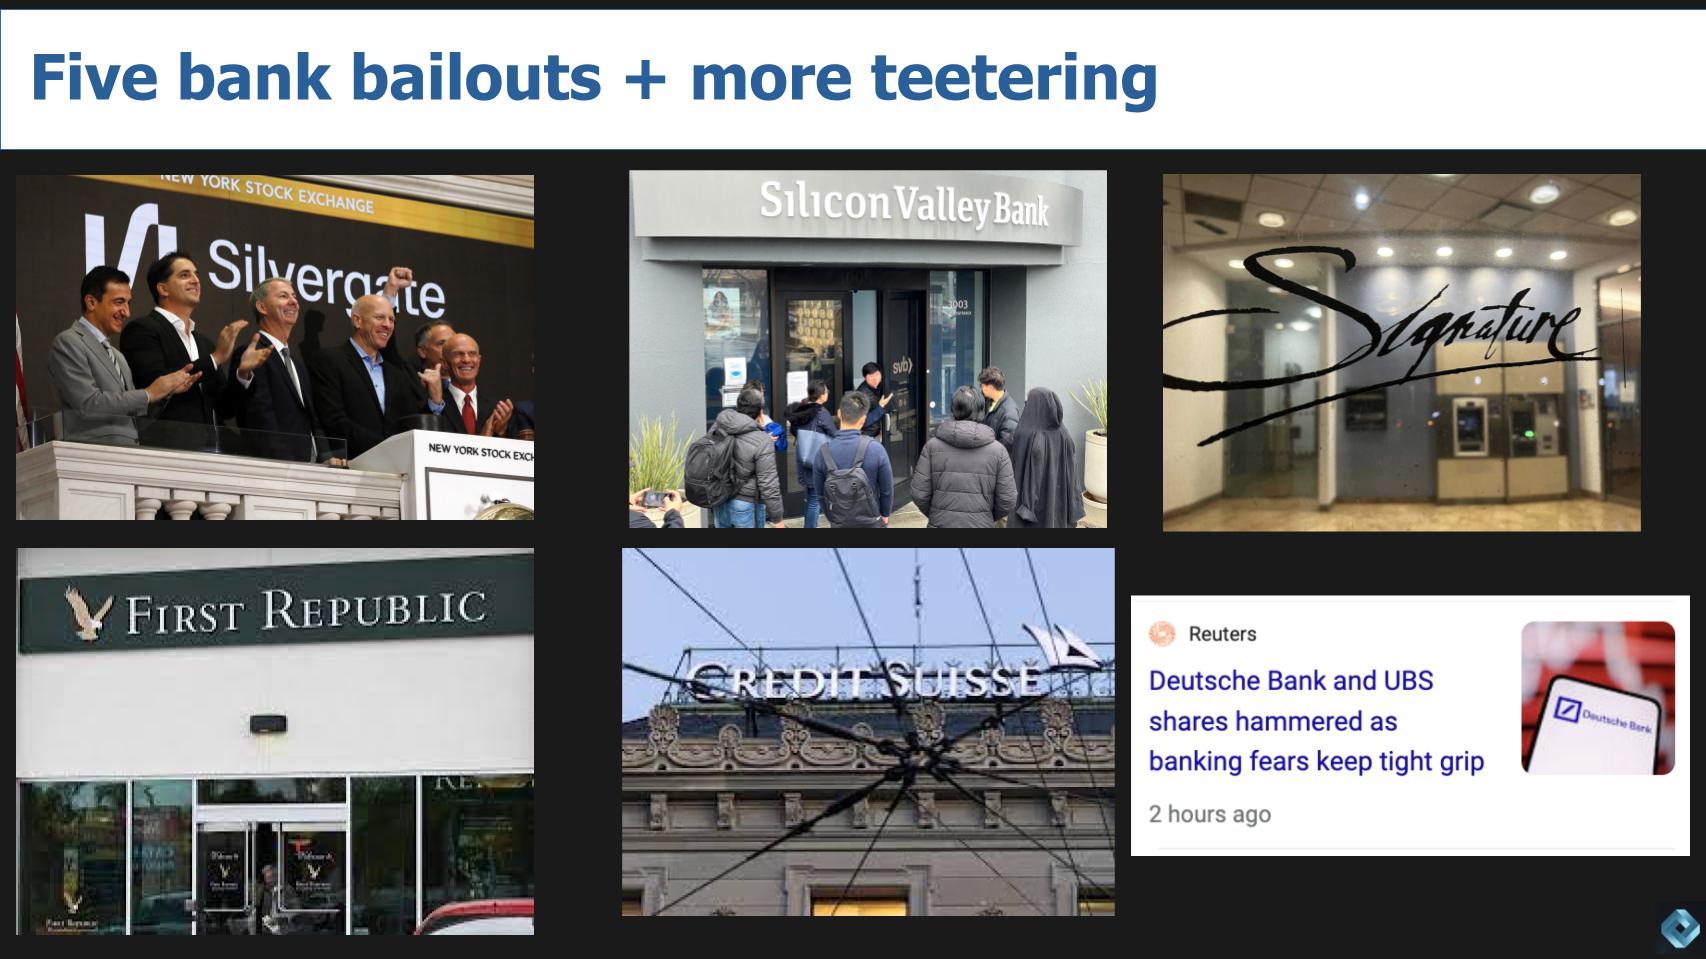
We’ve seen five bank bailouts this month starting with Silvergate Bank, then Silicon Valley Bank and Signature Bank. First Republic Bank was saved by a $30 billion loan from several large banks, including JPMC, Wells Fargo Bank, Bank of America and Citibank. Many say this wasn’t a bailout because it was the banking industry taking care of its own. How naive. Where did the money come from to prop up First Republic? Did it come from the vaults of those big banks? Actually, no. It came from the U.S. Treasury at attractive terms.
In other words, it was a government-backed loan (with a one-year term) to the big banks, secured against their depressed bond assets but valued at par. According to CNN:
The Federal Reserve created a loan system designed to prevent regional banks from failing after SVB collapsed. The facility will allow banks to give the Fed their Treasury bonds as collateral for one-year loans. In return, the Fed will give banks the value that the banks paid for the Treasuries, which have plunged in the past year as the Fed has hiked interest rates.
The pain continues. In a bit of a forced marriage, Credit Suisse, a very poorly run bank by all accounts, was absorbed by UBS under exceedingly favorable terms provided by the Swiss government. And just today, Friday, March 24, Deutsche Bank’s stock got crushed on fears that the financial exposures on its asset portfolio are uninsurable.
It seems like every crisis brings new terminology that goes mainstream. During COVID it was herd immunity, asymptomatic and contact tracing. In this case we have mark-to-market, duration risk and moral hazard. The former two generally refer to the delta between what a bank’s bond portfolio is worth on paper and the value at maturity. Because of rising rates, the paper value is worth much less than the value at maturity. The last implies that the Fed kept interest rates low to spur economic growth and help everyone but at the same time ignored the risks.
So how is it that after the 2008 financial crisis where more new words like credit default swaps, quantitative easing and stress tests were introduced that we ended up in this mess?
It’s quite a story. We’re not economists, but sometimes it feels like we each know just as much about potential negative consequences as do the most educated economists in the world. For example, at the Massachusetts Institute of Technology CFO Summit in November of 2007, the guest economic expert was asked if he felt mortgage defaults and poor-quality loans were a risk to the economy. And unequivocally this individual said no, there is no evidence in the data that suggests this is a critical risk.
Well, we know what happened when subprime mortgages imploded.
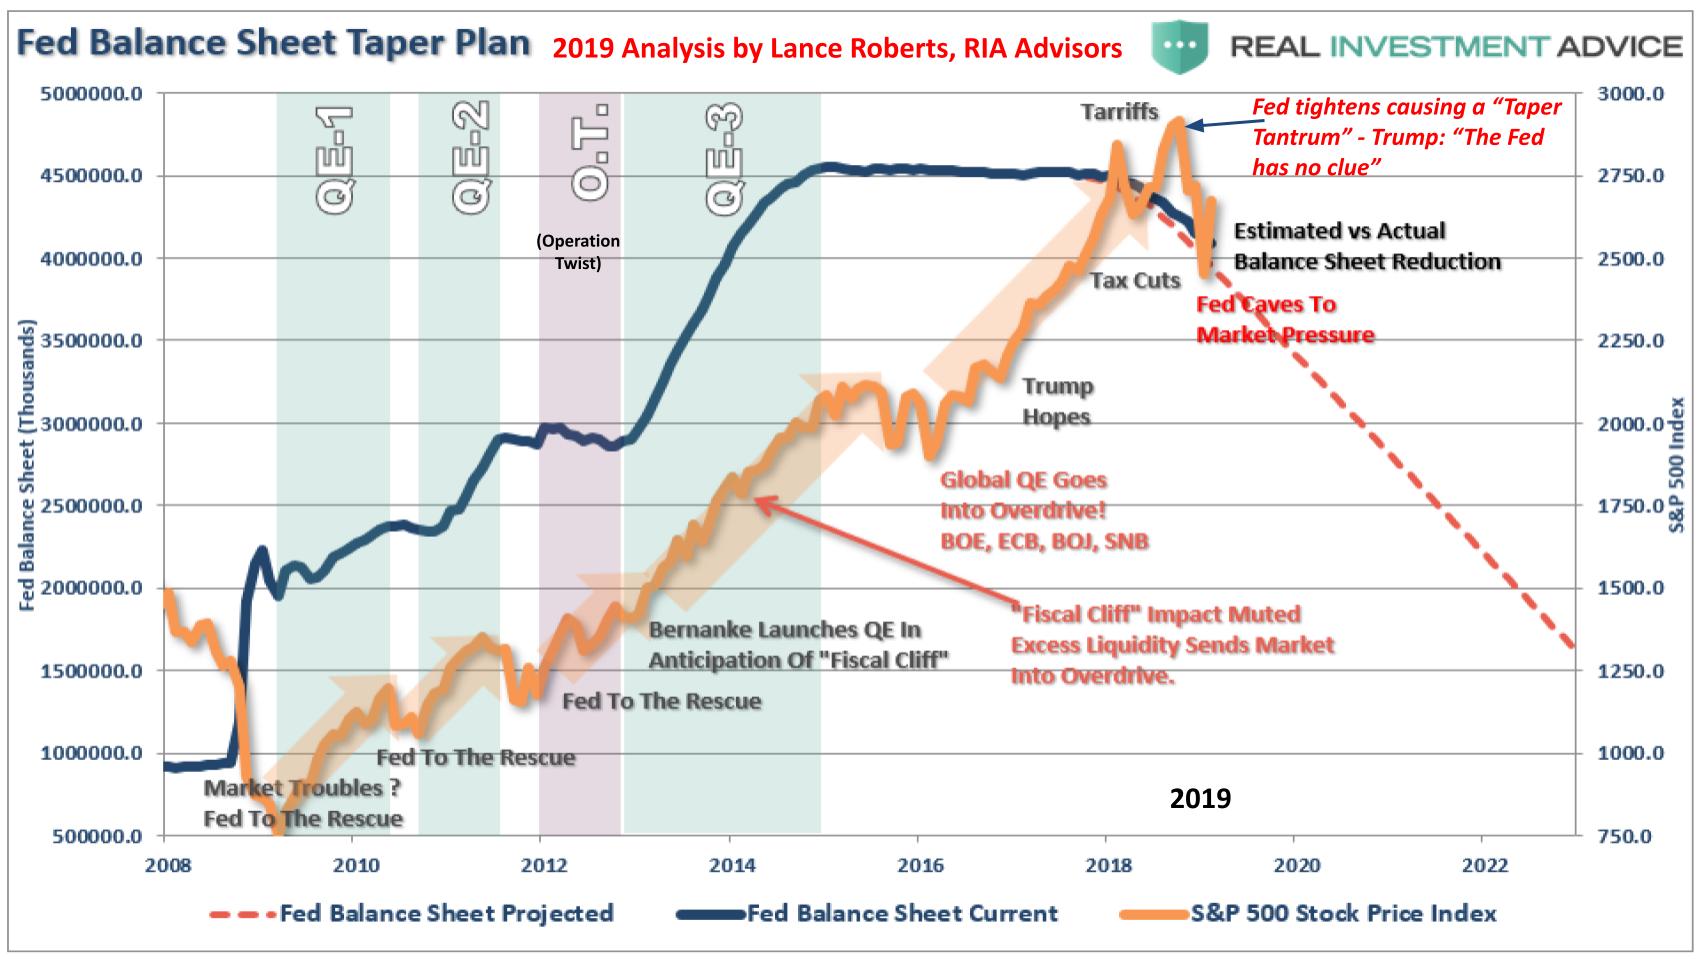
Above is a 2019 graphic from Lance Roberts, an analyst at RIA Advisors. It goes back to the beginning of the modern easy-money time period, which started with Quantitative Easing (QE 1) as a novel idea introduced by then-Fed Chairman Ben Bernanke. For the first time in history the Fed began purchasing bonds and other financial assets from banks to inject capital into the system. The idea was that by doing so, banks would start lending money again to small businesses and consumers.
The Fed didn’t game it out so well. Somehow it never dawned on it that banks are profit-driven and they could make more money by investing those dollars in financial assets that would give them a guaranteed return. So they bought up the same assets they just sold to the government because they knew the government was propping up those assets, essentially creating a no-risk return. This prompted President Obama to rail against big bank CEOs in 2009 when Main Street was still struggling but Wall Street execs were taking bonuses funded from that taxpayer debt.
Eventually QE started to have the desired effect and the economy slowly came back. In 2010 the market generally and tech in particular started its epic bull run. The thinking by many was that once the economy was back on track, the Fed would back off and let markets figure it out all by themselves. But markets were now hooked on easy money by that point.
Look at the brown line in the chart above (which is the S&P 500) and compare it to the start of the vertical colored bands (when the free money spigot was opened wider). What it shows is when the market dipped, the Fed would step in and print more money. In 2012 it even launched “Operation Twist.” Operation Twist was a monetary strategy the central bank used to stimulate growth by lowering long-term rates. How, you ask? By selling near-term treasuries to buy longer-maturity ones to keep interest rates low.
Despite the fact that the economy seemed to be back on track, it was apparently decided that what’s good for the stock market is good for America and the free flow of money continued.
President Trump took office in January of 2017 and that immediately fueled markets. In February of 2018, he appointed Jerome Powell, the current Fed chairman. Later that year, Powell began to taper the Fed’s balance sheet – see the blue line around late 2018. This caused what was referred to as a “Taper Tantrum,” meaning investors and in this case the POTUS complained that Fed policies were hurting markets. Trump railed against his appointee’s rate hikes saying “the Fed has no clue.” And so the Fed capitulated to the market’s demands.
The red dotted line was the projection in 2019 of the Fed’s balance sheet trajectory.
RIA’s Roberts at the time said he didn’t know when it was going to happen but put forth the likelihood of a mean reversion and put forth the possibility of a 50% correction based on some unknown event. He didn’t predict a pandemic, but he was right.
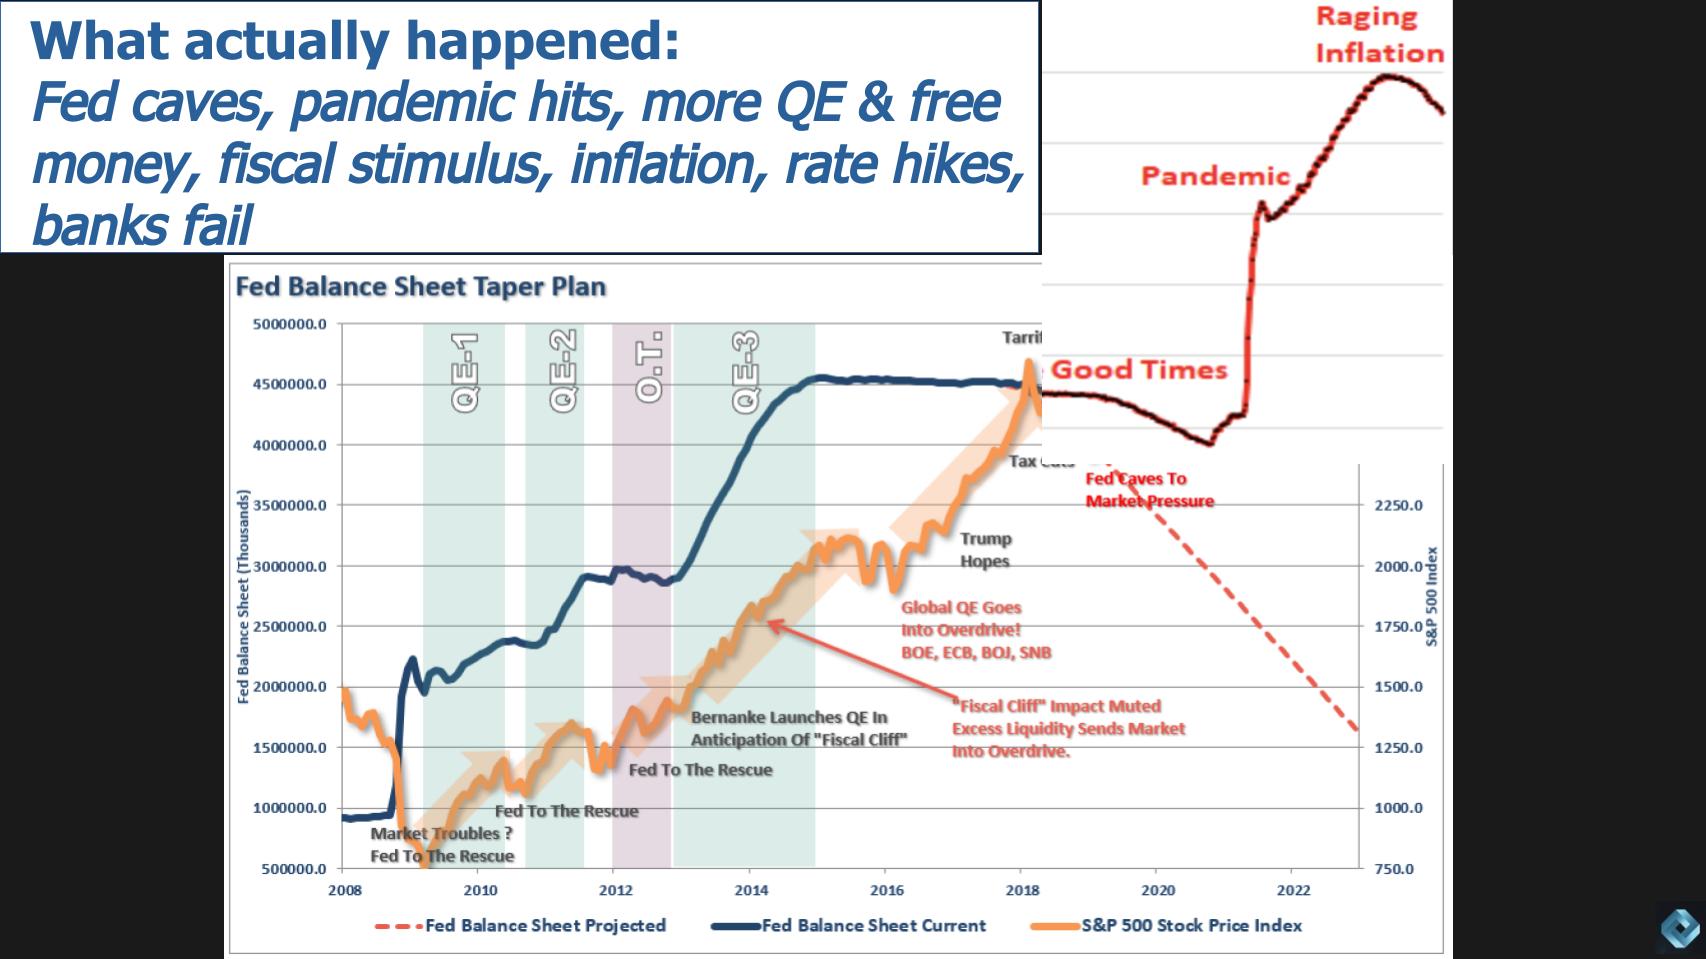
We all know the story. We’ve overlaid the Fed’s actual balance sheet trajectory, which dramatically veered from pre-pandemic expectations. The Fed caved to Trump and the markets, the pandemic hit, prompting the Fed to print more money under Trump. Then President Biden got more fiscal stimulus passed in the form of the $2 billion-plus Build Back Better legislation. Unsurprisingly, inflation turned out not to be “transitory.”
In response, as we know, the Fed went on an historic tightening vector to catch up. When rates rise, so do borrowing costs, which reduces demand among banks and other financial institutions to borrow money and crushes bond portfolios with long maturities. And it turns out that the stress tests for regional banks failed to consider the impact of rising interest rates on bond portfolios, and that’s how we got to where we are today.
Unfortunately, the picture is not pretty right now. Many argue that we missed an opportunity during the good times to invest that cheap money for the long term or maybe chip away at the debt.
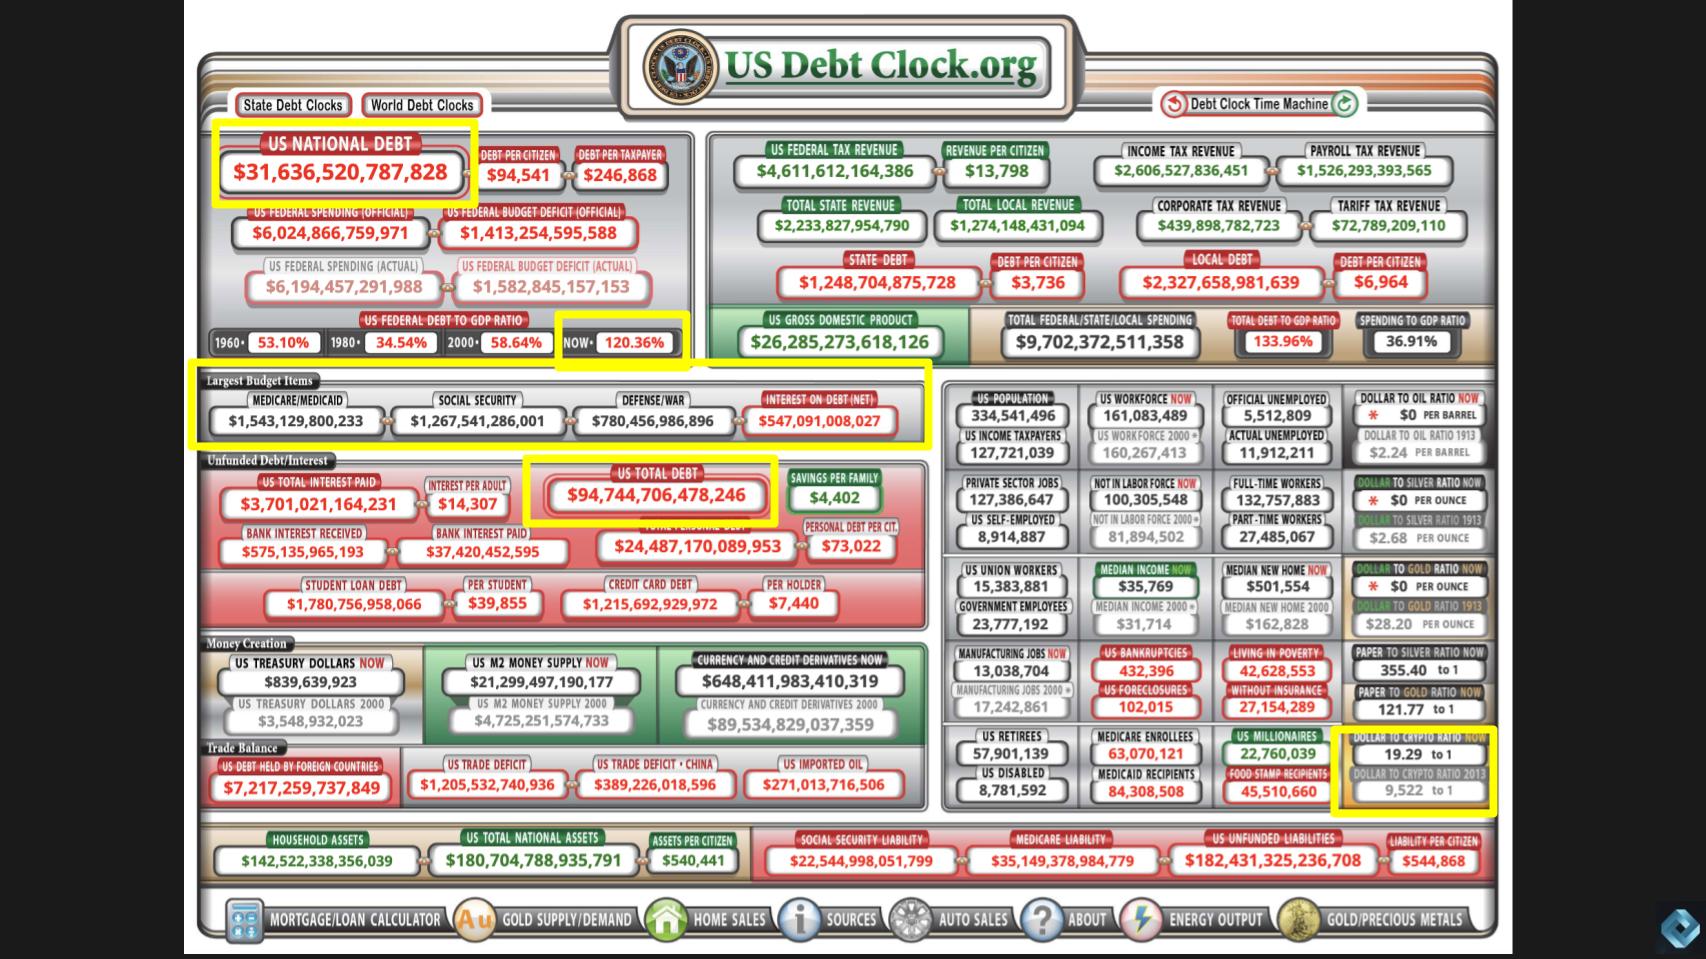
Instead, the government racked up more of it. Above is a screenshot of the debt clock. It’s a favorite website despite making you want to cry. U.S. national debt is now over $31 trillion as of this date. It’s currently growing at roughly a couple billion dollars per day. U.S. debt is now 120% of Gross National Product, up from 59% at the beginning of the millennium. Interest on that debt is over $547 billion as of this posting.
The math to fix the problem is simple and inferred by looking inside the yellow rectangle above. Stop spending more than you bring in… cut defense, Social Security and Medicare. But that’s not going to happen.
So far we’ve only talked about the debt of the federal government. When you add in households, state and local debt, financial institutions and the like, the debt is around $95 trillion. It will be $100 trillion soon.
One other little ratio worth noting on this chart on the bottom right. The M2 money supply is now only 19 times the market cap of all crypto, up from 9,522 in 2013.
What does that tell you?
The premise in this post is banks are going to spend less on IT in the coming months and until things calm down. Certain tech companies are overly exposed to the financial services sector and will feel the pinch as a function of their exposure and predicted spending momentum on their platforms. We want to examine the ETR survey data to see which companies have the greatest risk to this scenario.
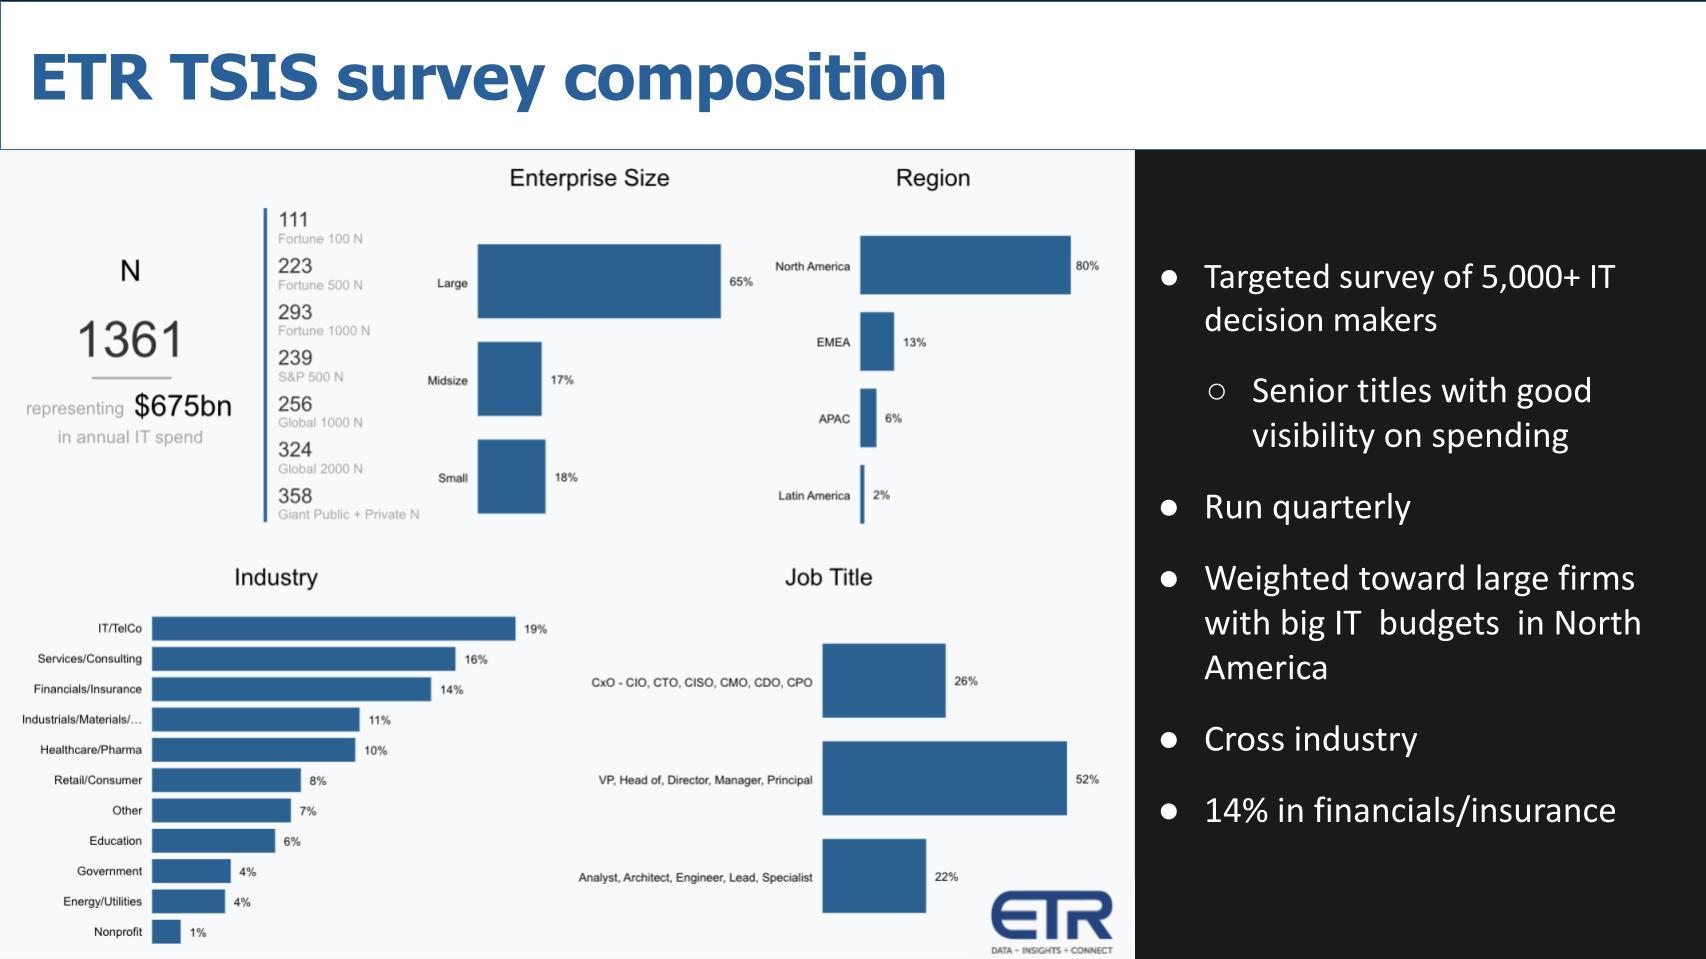
First, let’s look at the composition of ETR’s quarterly TSIS (Technology Spending Intentions Survey). It’s a survey that goes out to more than 5,000 IT decision makers. This quarter’s survey is currently in the field and will end up with over 1,500 responses representing around $700 billion in spending. Respondents are senior people that have been vetted by ETR as real decision makers with spending visibility. It is weighted, as you see above, toward large companies and also has a North America bias. But it is cross-industry, with 14% of respondents representing the financial services/insurance industry.
The methodology we’re using today is simple:
Note that the ETR industry segment includes financial services and insurance firms, which we use as a proxy for those most closely associated with banking.
With that out of the way, let’s look at those companies in the survey. We consulted with ETR’s Erik Bradley on this topic and we have some very preliminary data to share.
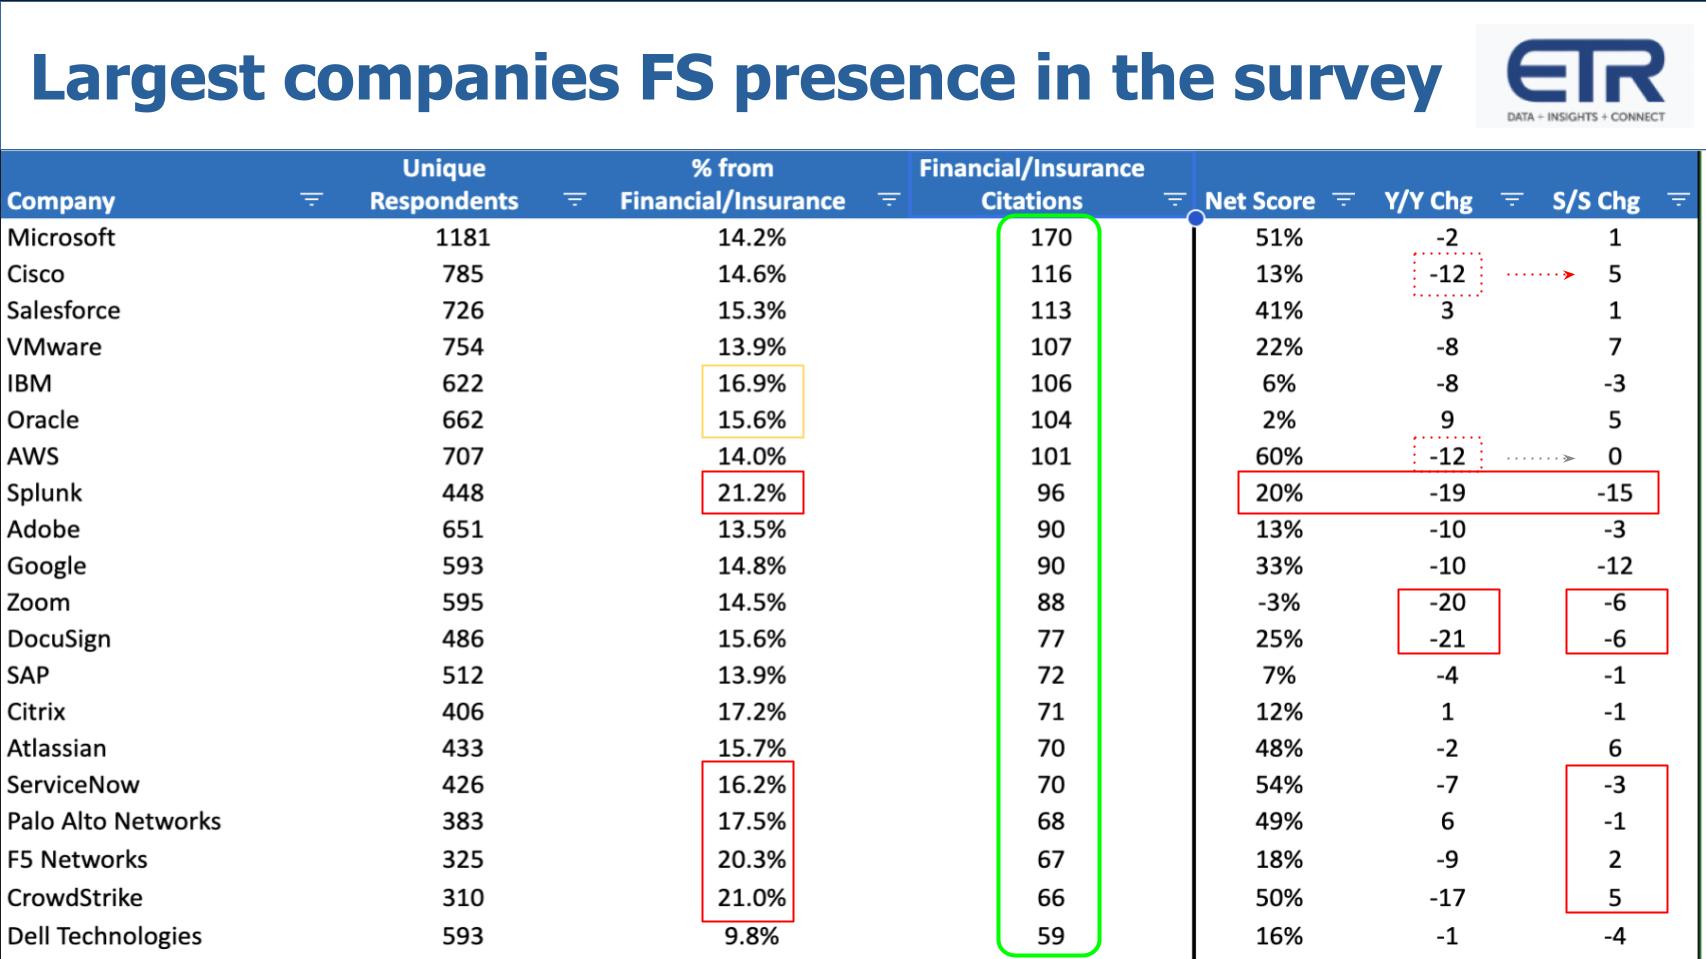
The first ETR chart above shows the companies in the survey sorted by the number of N within the financial sector (that green highlighted area). You see the company in the first column, next the total N in the overall survey, then the percentage that come from the FS. On the right-hand side of the chart, you have Net Score, which is a measure of spending velocity for that company’s products. Then the Net Score Y/Y change and the sequential change from the last quarter’s survey. We’re showing the 20 companies with the largest overall penetration in the survey (column 2), sorted by the number of respondents within FS.
The most pervasive firms in the sector within this survey cut are Microsoft Corp., Cisco Systems Inc., Salesforce Inc., VMware Inc., IBM Corp., Oracle Corp. and Amazon Web Services Inc. These firms, despite the overall annual deceleration (faced by almost all tech companies), appear to be weathering the storm on a sequential (quarter-to-quarter) basis. For example, though VMware’s Net Score is down eight points year-over-year, it’s actually up seven points sequentially. Of the top seven in financial services, only IBM is showing softness in its sequential Net Score.
One note on Google LLC: Although the data above looks discouraging for Google, a deeper dive into the ETR data set shows that Google Cloud is actually very strong within the financial sector. The seemingly poor performance is being driven by Google Workspace, which makes up a large portion of respondents in the survey.
Splunk (21.2%), CrowdStrike Holdings Inc. (21%) and F5 Networks Inc. (20.3%) have the highest mix of survey respondents within FS. Splunk stands out with a 19-point Y/Y decline in Net Score and a 15-point decline sequentially. Its Net Score in FS is 20%, which is well below our elevated benchmark of 40%, and the precipitous annual and sequential declines are concerning with a healthy representative N of 96 in the sector.
CrowdStrike, despite a significant 17-point Y/Y decline in Net Score, ticks up five points sequentially. On top of a strong quarter overall, this is perhaps less concerning than Splunk’s decline. ServiceNow Inc., Palo Alto Networks Inc. and F5 display flattish sequential Net Scores and are perhaps less concerning as well.
Moving to the right-hand side and back to the top, Cisco’s Net Score dropped 12 points in FS, but it’s up quarter-to-quarter. So that’s not a concern, it’s actually a positive. Similarly, AWS’ Net Score in FS is down 12% year-over-years, but it’s flat sequentially.
Zoom and DocuSign both appear to be exposed with significant year-over-year and sequential declines. Dell Technologies Inc. looks soft, but its exposure is well under the survey average of 14% and likely PC-related.
As we said earlier, cybersecurity is still the No. 1 priority among IT buyers, so it’s possible that several of these companies may not feel the pinch, particularly Palo Alto and CrowdStrike, which both have strong business momentum and have a portfolio large enough to consolidate redundant point products.
Splunk also has a big security presence but looks more vulnerable in the sector.
We’ll see how this all plays out next earnings season and we’ll look for clues in management statements to assess the impact of the banking crisis. There’s no doubt that will be a major line of questioning among financial analysts.
Let’s take another cut at the data. In the view below we sort on those companies that have the highest percentage of their total citations in FS (the green highlighted area). We also set an N of 100 or greater for their total responses in the survey.
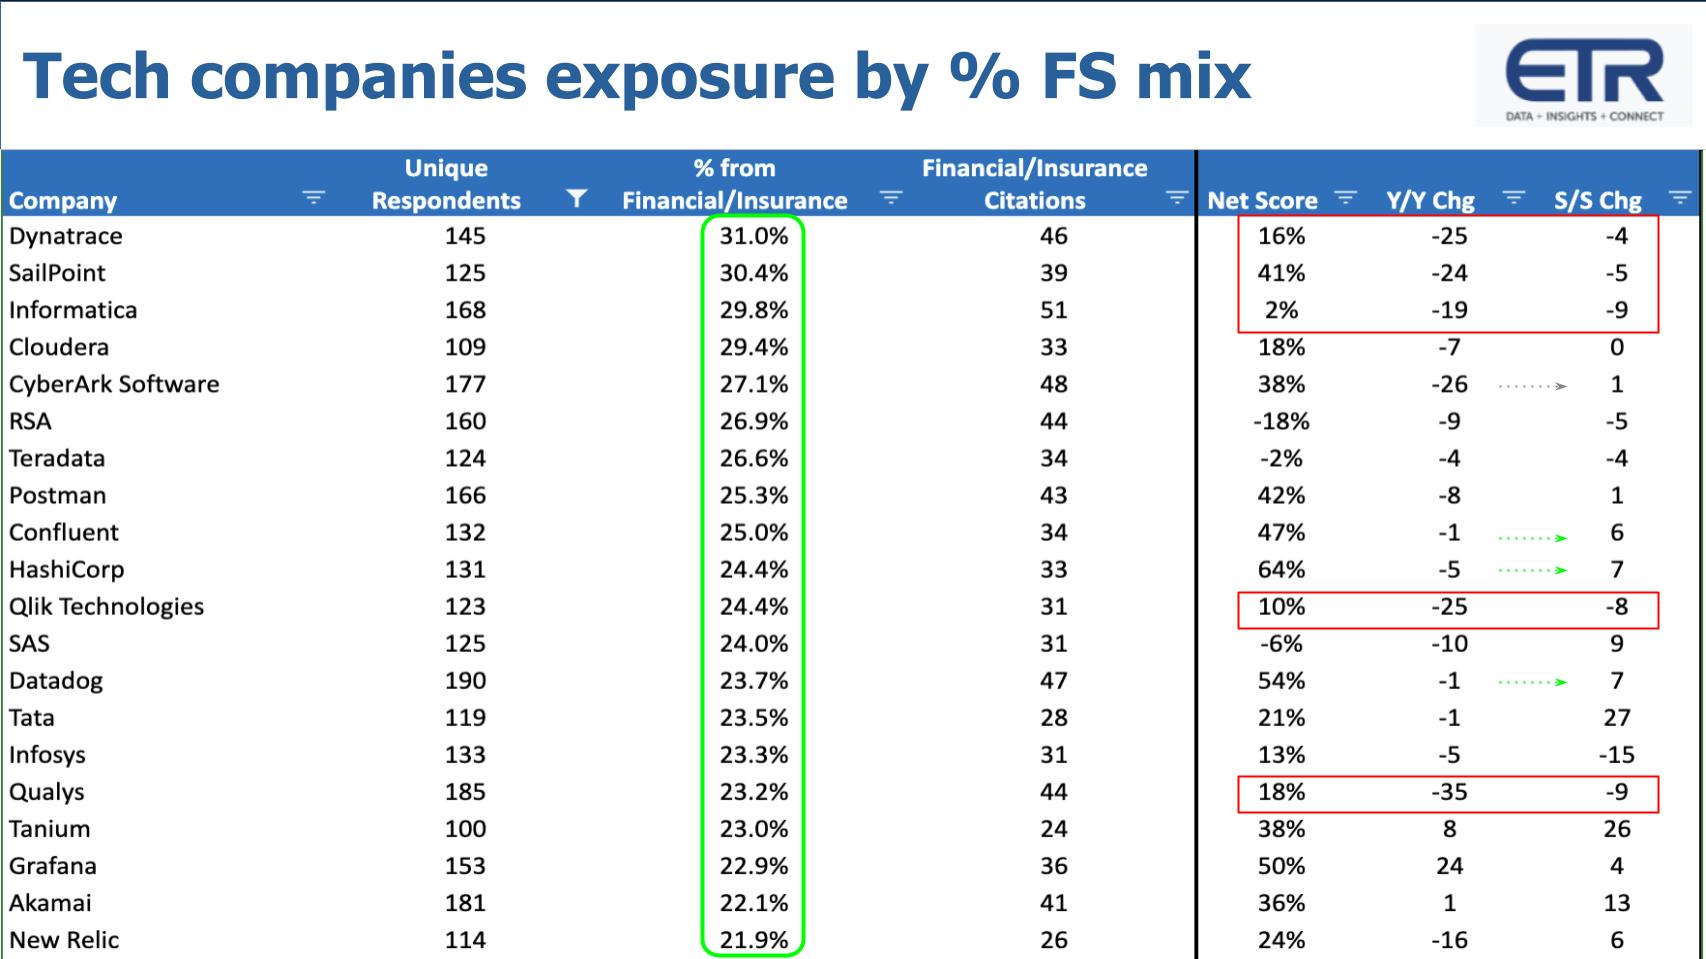
Dynatrace, SailPoint and Informatica stand out as all three are highly exposed in FS within the survey and each is shows steep year-over-years and sequential Net Score declines.
Cloudera Inc. is highly penetrated, but it’s flat sequentially, which is a neutral signal. CyberArk Software Ltd. appears exposed in FS, but sequentially its Net Score is flat. Qlik (QlikTech International AB) has filed for a confidential initial public offering and is acquiring Talend SA. Qlik is in the mid-stages of a total makeover, so we’re guessing there’s old DNA in this survey and it doesn’t reflect the new momentum the company will likely be touting at IPO.
Datadog Inc. looks to be bouncing back with a seven-point uptick in Net Score sequentially. But Qualys Inc. looks to be taking some hits — down 35% year-over-year in Net Score and 9% sequentially. Ouch.
Again, these are high-level snapshot data points and we’ll have to go back and see how these companies fare at earnings season. At least the public companies we’ll be able to gauge.
The last set of data we’ll share highlights some of our favorite names from Breaking Analysis episodes.
Below we show a semi-random selection of companies we follow that have an FS mix higher than the 14% survey average. We talked about Cloudera already. MongoDB Inc., not surprisingly, has a higher than average mix of business in FS within the survey and looks to be down sequentially, although holding year-over-year. Elastic N.V. is way down year-over-year but flattish sequentially.
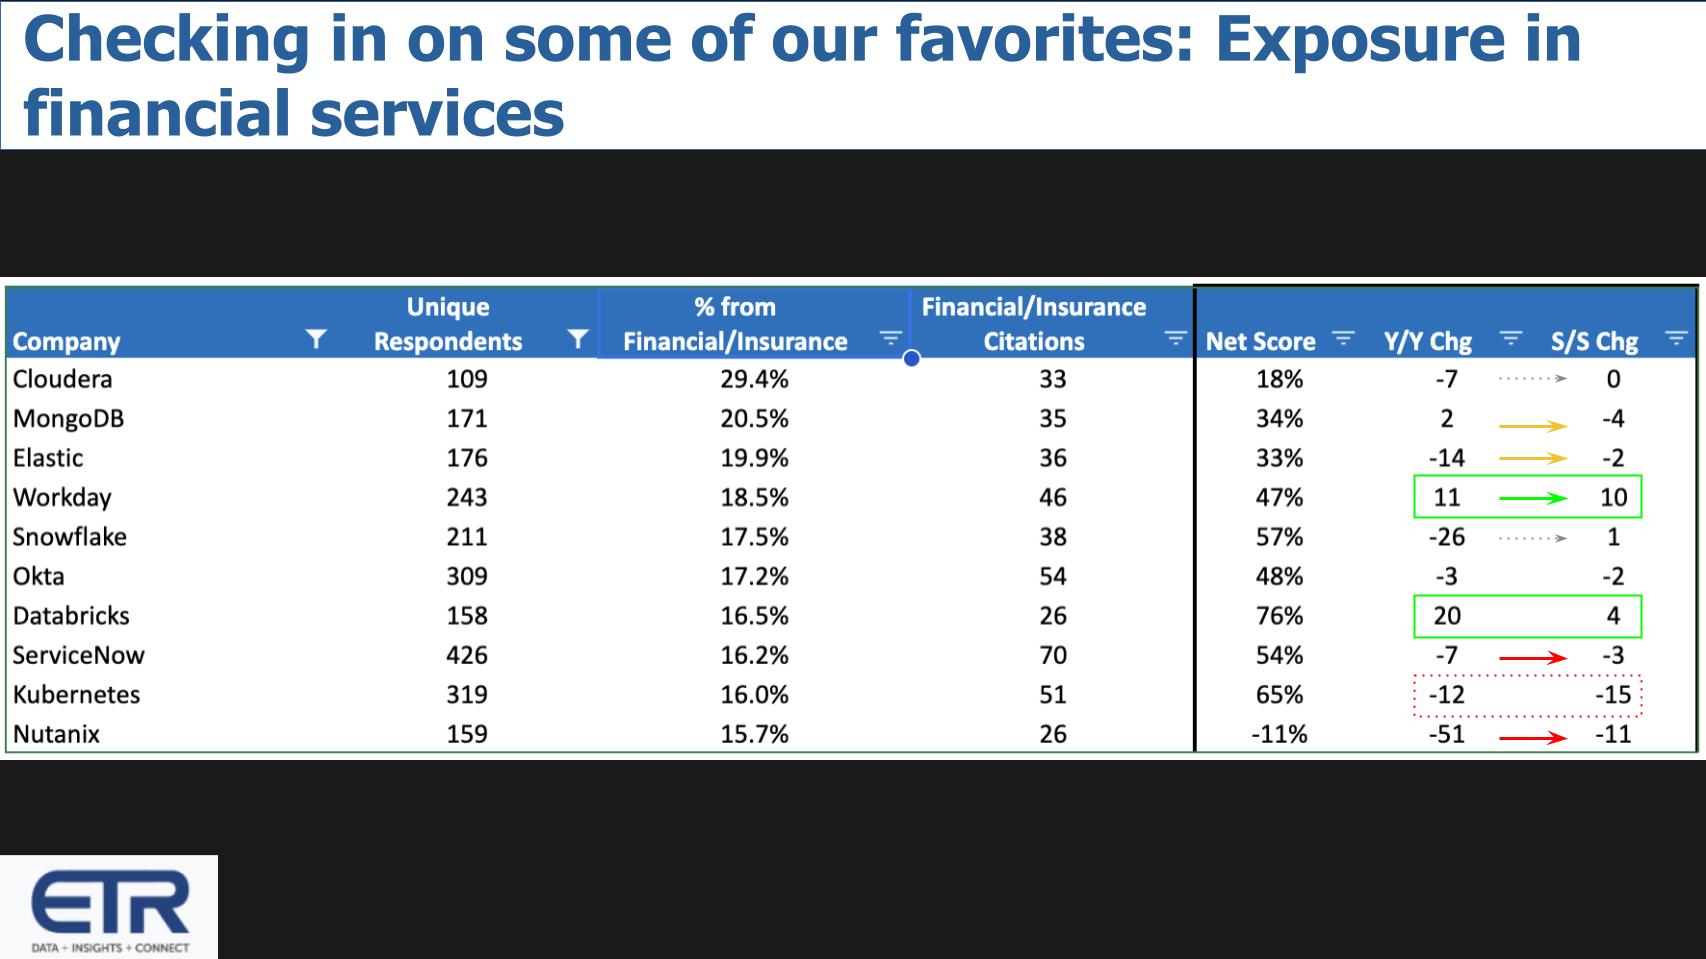
Workday and Databricks stand out in the data. Workday in particular is showing an 11-point and 10-point uptick in Net Score year-over-year and quarter-to-quarter, respectively. A double click into the ETR database on Workday shows the company has 0% defections in financial services and the vast majority of FS customers are spending more or holding firm. What banking crisis?
Databricks is interesting. Despite the concerns we raised two episodes back, its Net Score in FS is a whopping 76% — much higher than its Net Score overall, which is comparable to Snowflake Inc.’s high 50s. Databricks is up 20 points year-over-year and four points sequentially. This is likely thanks to the fact that many FS customers are sophisticated when it comes to data and that aligns well with Databricks’ offerings.
As well, last week Databricks threw its hat into the GPT model ring with news that its delivering an open-source generative AI capability that’s competitive with ChatGPT. This appears to not only ride the wave of AI buzz but seems to be a legitimate build your own GPT model approach that was trained on a much smaller data set than ChatGPT. It could have broad appeal in the market for those who don’t want to hand over their keys to OpenAI/Microsoft and have the stomach for DIY.
Financial services is Snowflake’s biggest vertical market and the company may even have a higher mix than the 17.5% represented in the ETR survey above. The FS cohort is also the most advanced in terms of data sharing activity amongst Snowflake’s customers, so it’s both a big revenue generator and strategic in terms of the company’s differentiation and total available market expansion. As we’ve reported, Snowflake’s overall Net Score is way down year-over-year from its stratosphere but that 26-point drop in FS shown above is notable and a concern given the importance of the sector. However, a double-click into the ETR database shows that the percentage of customers spending less or defecting is in the low single digits, meaning the company’s Net Score decline is a function of those customers shifting from spending more to flat spend. Additionally, Snowflake’s Net Score is flat sequentially, so it’s potentially a neutral indicator, but this is something that we will closely watch.
Nutanix has a small N with a mix that is only slightly above the survey average. Nonetheless, it has a negative Net Score that’s off 51 points year-over-year and 11 points sequentially. This is a function of a big shift in responses to the flat spend category. Nutanix does have decent new adoptions in FS, but existing customers appear to be hitting the brakes or spending less. Something to watch.
Finally, Kubernetes. We know it’s not a company. It still has a highly elevated 65% Net Score, well above the high water benchmark of 40%. But it’s down 12 points year-over-year and 15 points sequentially. Importantly of the 51 Kubernetes customers in FS within the ETR survey, 0% are spending less or defecting, so the decrease is purely a function of a shift to those with flat spending. Kubernetes still shows a healthy double-digit new-add percentage in FS and well over 50% of customers spending more.
We’ll close this data-heavy episode with some factors to watch in the months ahead. We’ll do a look back when earnings hit to see how predictive the survey data is within financial services, mapped against the spend climate in the sector.
Unfortunately, it seems policymakers line up along partisan lines, except when they’re trying to appear tough on China. But this means that Congress can’t be expected to pass legislation that will, for example, insure deposits over $250,000. That requires lawmaker action or a systemic risk. And Treasury Secretary Janet Yellen has been sending mixed signals and hedging, so that has markets concerned.
The Fed’s job is to make sure that the economy functions well, that inflation and unemployment are under control. Well, right now those two forces are counterposed and at odds. The Fed has to act like the lawyer in the courtroom when something bad happens. Act like you know it was expected. Even if you had no clue. The challenge with the Fed frankly is it’s data driven, but the data are questionable. Inflation is a lagging indicator and it’s unclear what impact rate hikes have really had on inflation. But one can only surmise that they’re serious and the economy is eventually going to feel it.
Friday’s market session ended up and actually shrugged off the recent rate hikes globally. It believes the Fed will ease this year. But the real tell will be valuations and earnings – real earnings, not the estimates. Right now the Nasdaq is trading at 22 times projected earnings, which is off its 35-times high during the boom. But like the Fed, CEOs and CFOs have less visibility right now. They’re guiding conservatively, but are they conservative enough?
And as negative as we’ve been today on the economy, the government, the Fed’s track record, the free money era and the market overall in FS, we remain optimistic. Technology is deflationary. And the wild card is AI and automation. AI in our opinion will create a productivity boom.
Like the Google IPO gave birth to a rebound in tech in 2004, AI, we think, has the potential to do the same. Yes, it might get a little “bubblicious,” but the market could use some sustained positivity right now. We do think it’s going to get worse before it gets better because of the banking crisis, likelihood of inflation and the massive debt. It will take a while for automation and AI to show up in the productivity numbers, but it will eventually, in our view. And that will positively affect earnings.
On balance we remain confident that the best is yet to come in tech.
Many thanks to Erik Bradley for his insights and contributions for this episode. Alex Myerson and Ken Shifman are on production, podcasts and media workflows for Breaking Analysis. Special thanks to Kristen Martin and Cheryl Knight, who help us keep our community informed and get the word out, and to Rob Hof, our editor in chief at SiliconANGLE.
Remember we publish each week on Wikibon and SiliconANGLE. These episodes are all available as podcasts wherever you listen.
Email david.vellante@siliconangle.com, DM @dvellante on Twitter and comment on our LinkedIn posts.
Also, check out this ETR Tutorial we created, which explains the spending methodology in more detail. Note: ETR is a separate company from Wikibon and SiliconANGLE. If you would like to cite or republish any of the company’s data, or inquire about its services, please contact ETR at legal@etr.ai.
Here’s the full video analysis:
All statements made regarding companies or securities are strictly beliefs, points of view and opinions held by SiliconANGLE Media, Enterprise Technology Research, other guests on theCUBE and guest writers. Such statements are not recommendations by these individuals to buy, sell or hold any security. The content presented does not constitute investment advice and should not be used as the basis for any investment decision. You and only you are responsible for your investment decisions.
Disclosure: Many of the companies cited in Breaking Analysis are sponsors of theCUBE and/or clients of Wikibon. None of these firms or other companies have any editorial control over or advanced viewing of what’s published in Breaking Analysis.
THANK YOU