

 NEWS
NEWS
NEWS
NEWS
NEWS
 Twitter’s long been one of the favourite sources of information for researchers studying people’s trends and perceptions, and for good reason – with millions of users spread across the world sending out billions of tweets every single day, there are few more easily accessible sources of data that represent the voice of just about every demographic there is. Including, shall we say, some of the more unsavory demographics.
To demonstrate this fact, a group of researchers from the Floating Sheep project, which shot to fame for mapping out racist tweets during President Obama’s re-election campaign, has come up with an interactive map of geo-tagged homophobic and racist tweets in the US.
The project, appropriately called the “Geography of Hate”, was carried out by a group of students at Humboldt State University in Arcata, Calif. A hugely painstaking task, it involved looking at all of the geotagged tweets originating from the US between June 2012 and April 2013, with the students manually reading each message containing a homophobic or racist term to determine if it had been used in a positive, negative or neutral context. The students felt this necessary, because terms like “dyke” often have positive implications, for example the phrase “dykes on bikes”.
Ultimately, the researchers found that more than 150,000 geotagged tweets sent over the duration contained hateful slurs used in a negative way. Most of our hatred was directed at gays and lesbians, with 95,123 tweets containing words like “homo”. Racism was all too common as well, with 41,306 tweets containing the word “nigger” in a negative context.
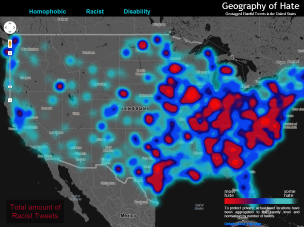
Writing for the Floating Sheep blog, researcher Monica Stephens explains how they went on to build their ‘Hate Map’:
“Hateful tweets were aggregated to the county level and then normalized by the total number of tweets in each county. This then shows a comparison of places with disproportionately high amounts of a particular hate word relative to all tweeting activity.”
This means that while Orange County, Florida, had the highest number tweets containing negative slurs, it barely figures on the map as these were diluted by its huge overall level of Twitter activity.
The map covers to separate traits – homophobic and racists. Homophobic tweets were determined by the use of terms like “fag”, “dyke”, “home”, and “queer”, while racist tweets included words such as “chink”, “nigger”, “wetback”, “spick”, and “gook”.
So what does the map tell us? Well, surprise, surprise, the big news is that hate speech is common all over the shop, although there are definitely one or two worrying concentrations in certain areas – for example, in this map we can see that Texans are far more likely to refer to Latinos as “wetbacks” than anyone else, something that’s hardly surprising given the number of Latin American immigrants there.

More eye-opening however is the seemingly much higher proportion of racist tweets in the east of the country – the following map for the word “homo” and “nigger” suggest that those on the east coast have far more pent up hatred than anyone in California.

But we should point out the failings of this experiment too. For example, just because people in the ‘red’ areas seem to use hateful slurs more often, doesn’t necessarily mean there are more racist/homophobic/evil people living there. Language is a telling factor for sure, but it’s not the only one. An individual with racist leanings is quite capable of refraining from using words like “nigger” and “spick”, but it doesn’t make them any less racist.
There’s another problem that needs to be considered to – the potential for a small number of extremely hateful Twitter users to skew the results for a larger segment of the population. This isn’t such a problem in larger population centers, but for counties with very few Twitter users its more than possible that one or two racist twitterers there could cloud that area’s sentiments.
Ultimately then, this “Hate Map” cannot be considered a reliable way to teach us where racism and homophobia are most prevalent in the US, but that doesn’t mean it’s totally useless. If nothing else, it helps to establish a dialogue on what remains a very important issue in our society today, and one that cannot just be brushed under the carpet.
Support our mission to keep content open and free by engaging with theCUBE community. Join theCUBE’s Alumni Trust Network, where technology leaders connect, share intelligence and create opportunities.
Founded by tech visionaries John Furrier and Dave Vellante, SiliconANGLE Media has built a dynamic ecosystem of industry-leading digital media brands that reach 15+ million elite tech professionals. Our new proprietary theCUBE AI Video Cloud is breaking ground in audience interaction, leveraging theCUBEai.com neural network to help technology companies make data-driven decisions and stay at the forefront of industry conversations.