 NEWS
NEWS
 NEWS
NEWS
 NEWS
NEWS
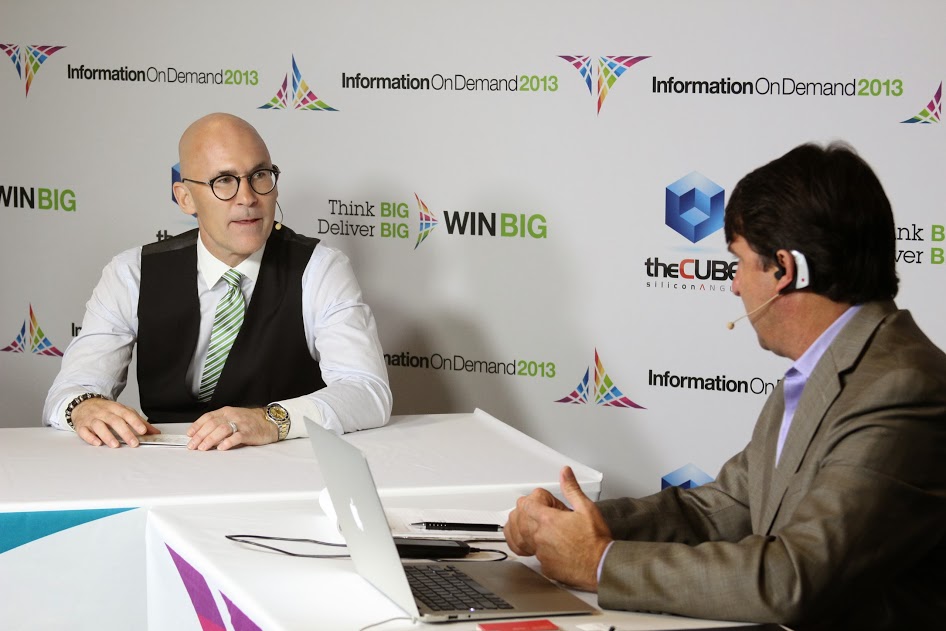
![]() Les Rechan, General Manager and Business Analytics with IBM, joined #theCUBE co-hosts John Furrier and Dave Vellante at the IBM Information on Demand 2013 event in Las Vegas, to discuss – among other things – the six Big Data imperatives and how to create a data-driven culture.
Les Rechan, General Manager and Business Analytics with IBM, joined #theCUBE co-hosts John Furrier and Dave Vellante at the IBM Information on Demand 2013 event in Las Vegas, to discuss – among other things – the six Big Data imperatives and how to create a data-driven culture.
How can you make it easier for people to consume data? asked Furrier. “You want to have more rapid insight action,” replied Rechan.
“What we’re trying to do here is make it a lot easier for users to not only visualize and explore, but to see the patterns in the data. We want to change the whole analytic experience and to guide them into making decisions,” Rechan starts. “When you look at the organizations today, you think about descriptive analytics – what’s going on. An then you diagnose it: why is it going on? You look at the future with predictive analytics and even prescriptive analytics – with things like looking at next best action.”
IBM is playing in different verticals, and each has its own outcome objectives, so that means different analytics. How does IBM manage the entire process?
“The key here is we focus on taking advantage of all data – whether it is structured or unstructured, whether it is in motion or at rest – and then we want to deliver all analytic capability, from descriptive all the way to cognitive, and then all solutions. That’s how you get into the verticals,” Rechan explained.
“Take the capability that we got (all data, all analytics, all solutions) and apply it. When you think about analytics (social, mobile, cloud), we’re looking at systems of engagement, presenting information to people on the front line that could come from many heterogeneous data sources. We want to be able to bring that together – and we have solutions that do that – and then bring it together for that user and for that particular problem.”
What has originally started as a trend, has grown and matured to the extent of surprising even the early adopters: “It’s really gotten bigger than anything I would have ever dreamed of,” admits Recha. “This is the whole theme of this conference: Think Big. Deliver Big. Win Big. At the same time, we do have a view of where this thing would evolve to.”
“You have the 4 V’s of Big Data: Volume, Variety, Velocity, Voracity, but we talk about having the Vision and the Value – imagining the future and being able to realize it with the Big Data and Analytics architecture, and being able to trust it in terms of security, privacy, and risk,” Rechan continued. He then goes on to note some initiatives IBM’s working on towards these goals, while recalling some of the top features requested by customers, boasting that business couldn’t be better: “15 cents of every IT dollar.”
Project Neo (next generation data discovery capability) was developed in the spirit of being faster, easier, smarter. It’s making visualization capabilities and learning capabilities available to all workers.
Some of the top things customers ask for include business outcomes delivered very quickly and assisted journeys. They want to be helped to understand where they should be going.
Support our mission to keep content open and free by engaging with theCUBE community. Join theCUBE’s Alumni Trust Network, where technology leaders connect, share intelligence and create opportunities.
Founded by tech visionaries John Furrier and Dave Vellante, SiliconANGLE Media has built a dynamic ecosystem of industry-leading digital media brands that reach 15+ million elite tech professionals. Our new proprietary theCUBE AI Video Cloud is breaking ground in audience interaction, leveraging theCUBEai.com neural network to help technology companies make data-driven decisions and stay at the forefront of industry conversations.