


 NEWS
NEWS
NEWS
NEWS
NEWS
 Stephen Boyer, CTO and Co-Founder of BitSight Technologies has a different perspective on malware activity. In the following guest post he introduces research from his company’s team of data scientists and provides analysis of global activity based on IP addresses. What’s interesting about this analysis is that rather than plotting malicious activity on a global physical map, the piece looks at this type of activity differently. By plotting this activity along the virtual global of the IP address space, a deeper understanding of malicious activity is introduced. Where these addresses reside are not nearly as relevant as who they belong to. The result is a better sense of implication of malicious activities in the context of IP addresses and who they belong to.
A different perspective on malware activity
By Stephen W. Boyer
CTO & Cofounder, BitSight Technologies
Looking at the world through a different lens often reveals hidden insights about the wonders around us. Take, for example, the discoveries we have made through our analysis of big data. At Google, scientists are using Internet search data to calculate the spread of the flu. In near real-time, they are able to estimate the number of flu infections based on search volumes from a given location on flu-related topics.
This is an alternative to existing flu surveillance programs where updates are far less frequent, rely on patient treatment data and focus only on particular regions; Google is able to use this model globally, giving an objective, continuous measure of flu activity instead of the narrowly focused, regional-based models health professionals have been accustomed to. The advantage of using Internet data in this application means that health professionals are better able to stay ahead of and treat seasonal outbreaks and potentially prevent global pandemics. This is an astonishing example of a data-driven risk model at work.
What else can we learn from taking a different perspective? There have been lots of studies looking into the distribution and origination of malware across the globe. One thing that strikes me from these studies is that, as is to be expected, the areas with the highest developed populations have a higher amount of malware infection. What does this tell us? Naturally, where there are more people there are more computers, and therefore more infected machines. How does this help us to take action against malware threats?
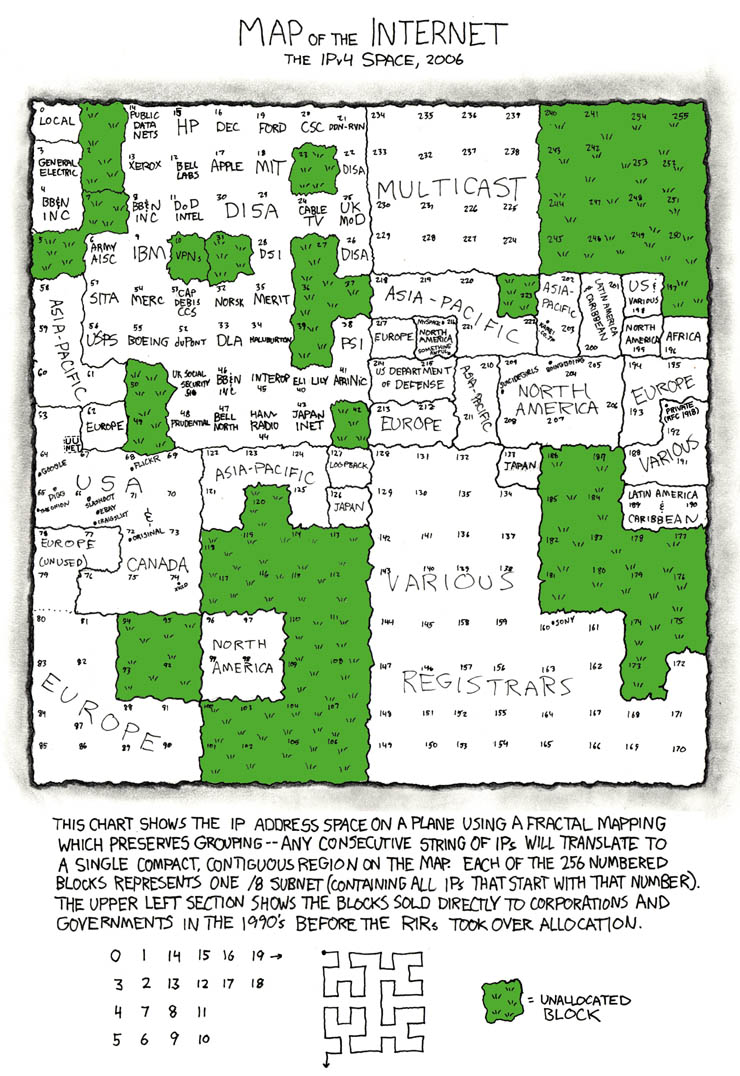
Instead of looking at where malware infections are prevalent, I find it more useful to look at who has been infected. This can be done by plotting global malware activity against an IP address-based map, which is represented in the figure below.

Figure 1: Week 1: Global IPv4 Malicious Activity. Source: BitSight Technologies
Here, our data scientists have used a Hilbert Curve 2-dimensional layout to plot the malicious activity across the entire IP version 4 address space. The major block sizes here are 1/256th of the entire IP version 4-address space (the bulk of the Internet) of the nearly 4.3 billion addresses. For example, the top left block represents all of the 16.7 million IP addresses that start with “0.” (ex. 0.0.0.1). Each dot represents the same malicious activity from a one-week slice observed and plotted on the geographic plot above. The black areas are either reserved and unused IP blocks or areas where we observed no malicious activity. In regions where there is an overwhelming amount of activity the area turns red as large numbers of dots eventually fill in the area completely.
By continuously looking at the virtual cyber world outside the context of the physical world we can gain a new and arguably more insightful perspective: some IP addresses are more infected than others and activity varies at these addresses over time. Let’s take a look at these variations in more detail.
The two plots below represent data over 2 separate weeks. By examining these plots, it is obvious the behaviors are not static. The volumes, classes, and intensity of malicious activities vary over time. The dynamic aspects of the attack and recovery cycle are on full display. Looking at this map across a broader time frame shows that some activities persist for long periods of time where others are fleeting. Interesting.
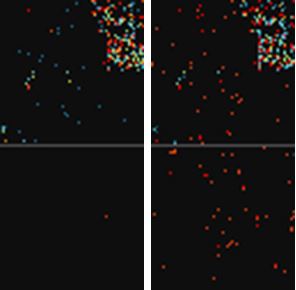
Figure 2: IPv4 Malicious Activity in Week 1 (left) and Week 2 (right). Source: BitSight Technologies
What is also immediately clear from this perspective is that the malicious activity is not uniformly distributed across the address space. Different groups of addresses or network blocks have different levels and classes of malicious activity. Some networks are much worse than others and some change more rapidly than others.
If we zoom into a particular block, the network-by-network variation becomes more apparent. Figure 3 isolates and highlights the block of 16.7 million addresses starting with “5” (ex. 5.0.0.1). Within this block of millions of addresses there are over 860 different organizations that own or control them. Taking these two variables into consideration, we gain insight that was lacking from a simple geographic based map of infection.
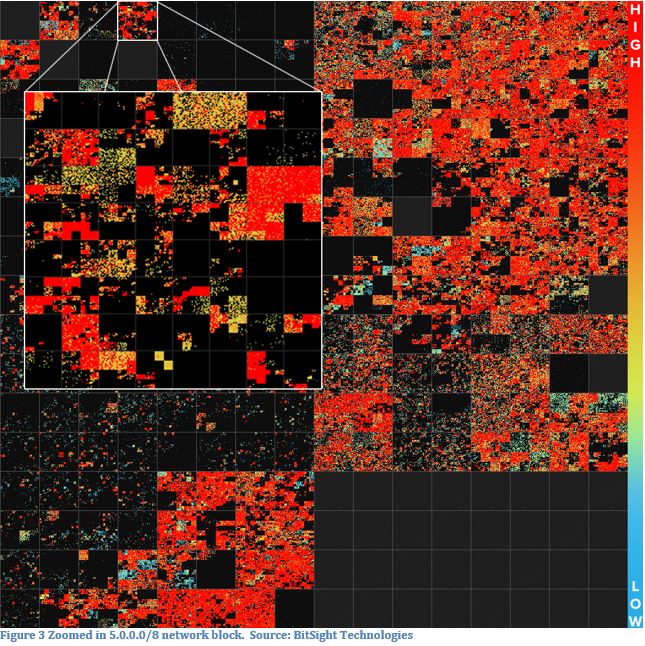
Figure 3 Zoomed in 5.0.0.0/8 network block. Source: BitSight Technologies
An IP address perspective in this case enables us to start to answer some of the who and what sorts of questions with respect to risk management. Even a cursory examination from this perspective makes it obvious that there are clear differences from network block to network block. Different organizations own and control those networks and there are clear, observable differences among them.
The behavior of an organization as measured from this new perspective helps to us better understand what some organizations might be doing differently or better than others. Some organizations have less malware than others. Others detect and remediate at a faster pace. An address based perspective moves us toward asking better questions and understanding who is doing well and what is working for those high performers. This insight then becomes the basis for new risk models that enable us to measure security effectiveness and provides a level of transparency into how successful organizations are against cyber attacks. Similar to how Google is able to measure and provide insight about where resources should be directed to fight flu outbreaks, this perspective on malware infiltration allows organizations to take action against a different type of infection.
THANK YOU


