


 CLOUD
CLOUD
CLOUD
CLOUD
CLOUD
Google LLC is making the same software it uses to test the performance of its internal applications in production available on the Google Cloud Platform.
The new products, introduced today, are designed to help developers spot any issues with their apps running in production, the company said. Without these tools, Google said, it can be particularly difficult for developers to track down performance issues while their apps are up and running.
Google’s Application Performance Monitoring tools are made up of two existing products, plus a new tool called Stackdriver Profiler, which is designed to profile how software code executes in production in order to help developers optimize performance and reduce computation costs.
Stackdriver Profiler was built to solve three primary issues, Google Product Manager Morgan McLean explained in a blog post. First off, Profiler can analyze code execution across all kinds of environments, including development and test environments where this previously wasn’t possible.
Second, unlike other performance monitoring tools, Profiler doesn’t hurt application performance while it’s doing its job, which means end users won’t notice any issues while the tool is running.
Third, Profiler is inexpensive to run, which means developers have less incentive to fix any performance issues by simply scaling up their cloud resource usage, which would raise their monthly bills.
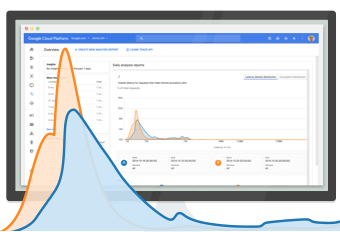
“Stackdriver Profiler collects data via lightweight sampling-based instrumentation that runs across all of your application’s instances,” McLean wrote. “It then displays this data on a flame chart, presenting the selected metric (CPU time, wall time, RAM used, contention, etc.) for each function on the horizontal axis, with the function call hierarchy on the vertical axis.”
The other tools in Google’s application performance monitoring box include Stackdriver Debugger, which provides an easy way to debug apps once problems have been identified. There’s also Stackdriver Trace, which analyzes customer requests in running apps and provides data that can be used to solve latency issues.
Google said all three tools are currently free to use. Stackdriver Profiler is available in beta, while Debugger and Trace are generally available now.
Support our mission to keep content open and free by engaging with theCUBE community. Join theCUBE’s Alumni Trust Network, where technology leaders connect, share intelligence and create opportunities.
Founded by tech visionaries John Furrier and Dave Vellante, SiliconANGLE Media has built a dynamic ecosystem of industry-leading digital media brands that reach 15+ million elite tech professionals. Our new proprietary theCUBE AI Video Cloud is breaking ground in audience interaction, leveraging theCUBEai.com neural network to help technology companies make data-driven decisions and stay at the forefront of industry conversations.