


 INFRA
INFRA
INFRA
INFRA
INFRA
As COVID-19 has disrupted so many aspects of everyday life, the spreading pandemic has also created a bifurcated information technology spending climate.
Several vendors taking advantage of cloud and work from home tailwinds are thriving, while others relying on legacy stacks and maintenance streams are struggling to show momentum.
This story of the haves and the have-nots is playing out in several sectors that we examine in this week’s Breaking Analysis. Here again we invited in Enterprise Technology Research Director of Research Sagar Kadakia to cover the following items:
As we’ve been reporting, there are three top-level themes we’ve been communicating: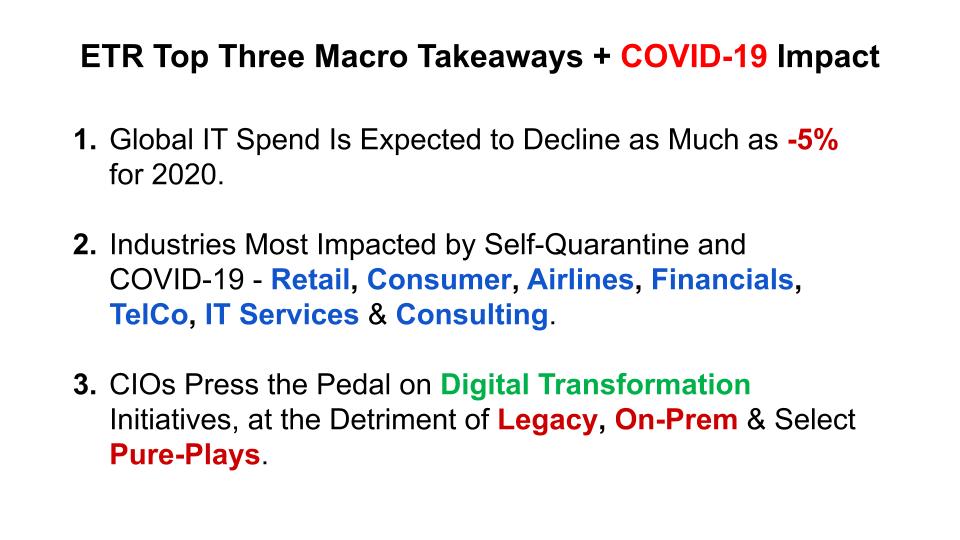 Although market forecasts will continue to change as we capture more survey data from the ETR respondents, we believe IT spend could contract by as much as 5% globally. The hit will be most pronounced in the industries cited above but again, even within these suffering industries, the picture is mixed.
For example, many retail operations are shutting down while Amazon.com Inc. returns to the “Trillionaires Club.”
Many airlines around the globe have taken government money, but at the same time, several high-profile names have cut back hourly workers and are signaling furloughs will happen when the no-layoffs bailout threshold is passed in October.
Banks are getting hit with the low-interest-rate climate, but at the same time they’re liquid thanks to the resiliency measures put in place after the 2008 financial crisis. The quality names have the cash to weather the storm, it seems.
Chief information officers at companies that for many years have talked the digital talk but haven’t fully taken the plunge are accelerating digital and cloud at the expense of traditional legacy platforms.
And so it goes. We’re in the middle of earnings season, and as we’ve stressed, we should not be ignoring the data from these reports. There are many clues that we can gather to form our thesis going forward, squinting through the bifurcated IT spending climate and picking the winners.
Here’s Sagar Kadakia’s commentary on the macroeconomic picture.
As we reported last summer, built-for-cloud data stores are shaking up the database and data warehousing market. The chart below shows this and underscores the bifurcation we highlighted earlier. The data identify the percentage of respondents replacing platforms compared across three survey samples.
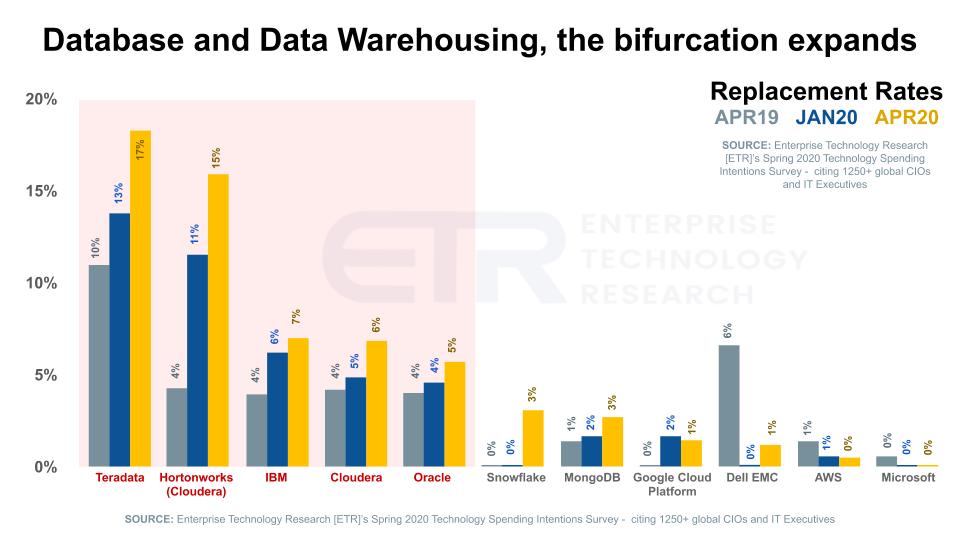
Here are the takeaways from this data, which again shows bifurcated IT spending:
Here’s Sagar Kadakia’s commentary on the database market — another story of a bifurcated IT spending market.
Let’s talk about the workflow and its relationship to the ITSM market. ServiceNow Inc. just announced earnings and continues to show consistent performance. The company, which used to trail in the valuation shadow of Workday Inc., now has a nearly double the market cap of the human capital management stalwart.
TheCUBE, SiliconANGLE Media’s video studio, has been following ServiceNow for many years, from the early days of Fred Luddy, its ascent under Frank Slootman, the short stint of John Donahoe and now Bill McDermott as the chief executive. Early on, when the company’s value was under $10 billion, we forecast the potential for the platform to grow and our predictions seem to be playing out.
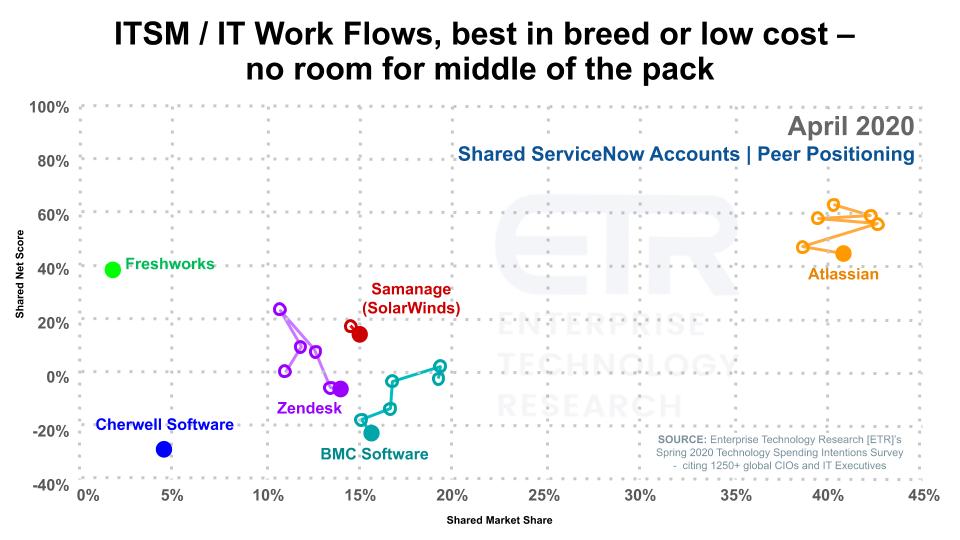
The chart above looks inside ServiceNow accounts to see if there are any obvious competitive vulnerabilities. The horizontal axis shows “Shared Market Share,” which is a measure of pervasiveness in the survey sample as measured by shared accounts. The vertical axis shows spending velocity or “Shared Net Score” within ServiceNow accounts.
Although the companies cited may represent a mix of capabilities, there is definitely some overlap with ServiceNow. The main complaint you hear from ServiceNow customers is pricing. One customer told us they felt like ServiceNow was becoming the Oracle of ITSM. There are other complaints, but this is the most common.
So customers do look for alternatives but as you can see in the chart above, there aren’t many that have traction. Only Atlassian Corp. plc has both market presence and spending momentum with ServiceNow accounts.
This data bodes well for ServiceNow, which has a strong Net Score in ETR’s April survey (above 50%) and a consistent, predictable business model. The theme of a bifurcated IT spending environment continues.
Here’s Sagar Kadakia’s explanation of the workflow ITSM drilldown.
In a previous Breaking Analysis, we highlighted how the coronavirus crisis is accelerating customers’ move away from MPLS networks toward SD-WAN to create a more flexible, distributed capability. As in other sectors, networking is no exception, and there’s also evidence of bifurcated IT spending.
The chart below shows some of the stronger networking companies within public cloud accounts as measured by Net Score or spending momentum within the survey. ETR isolated on AWS, Azure and Google Cloud Platform accounts.
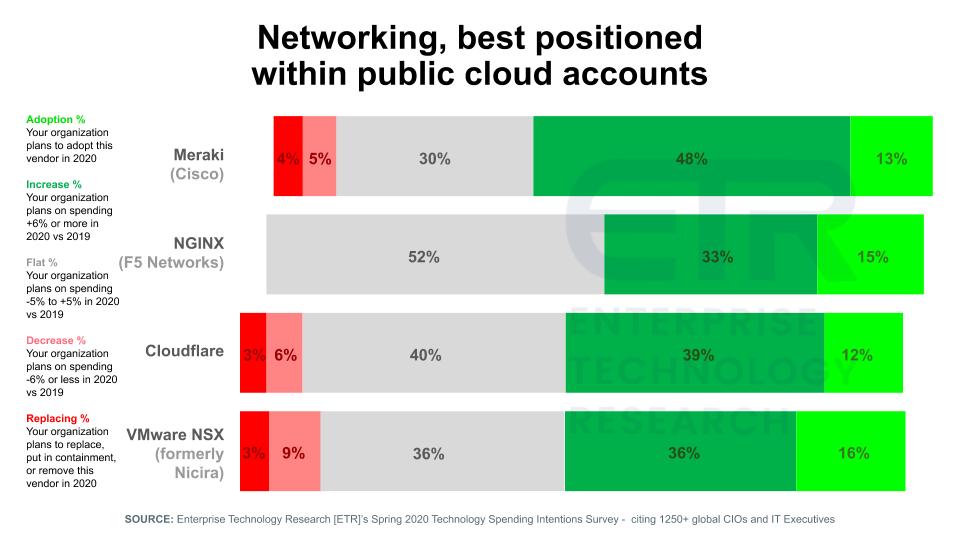
You can see in the data above, Cisco Systems Inc.’s Meraki (wireless and software-defined wide-area network) is well positioned along with NGINX Inc., Cloudflare Inc. and VMware Inc.’s NSX. There are two notable points we want to make: 1) These offerings are all relatively modern solutions that can take advantage of cloud; and 2) They all relate to building out distributed cloud and edge network architectures.
Here’s Sagar Kadakia’s take on the networking data.
The chart below isolates those respondents out of the 1200-plus who said their organizations were increasing IT spending in 2020, despite the COVID-19 pandemic. So well over 200 respondents indicating higher spend because of the work-from-home offset.
The data show Net Score or spending momentum. One would expect that all organizations in the CDN market would see momentum, but once again, the bifurcation theme shines through.
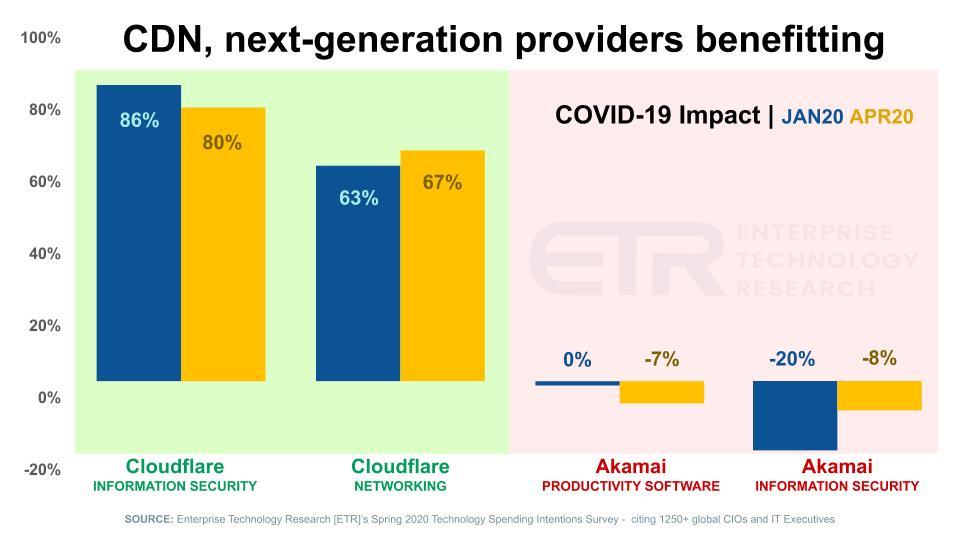
As Sagar Kadakia points out, this is spending momentum, not market share or pervasiveness, where Akamai Technologies Inc. would shine. Nonetheless, a flat Net Score for productivity software and a decrease in the negative Net Score for Akamai security is not positive news for the CDN leader.
As we’ve previously reported, virtual desktop infrastructure has seen a big boost from the pandemic. The chart below shows the very strong spending momentum (Net Scores) for some of the leading VDI players. The data are isolated on the Fortune 500.
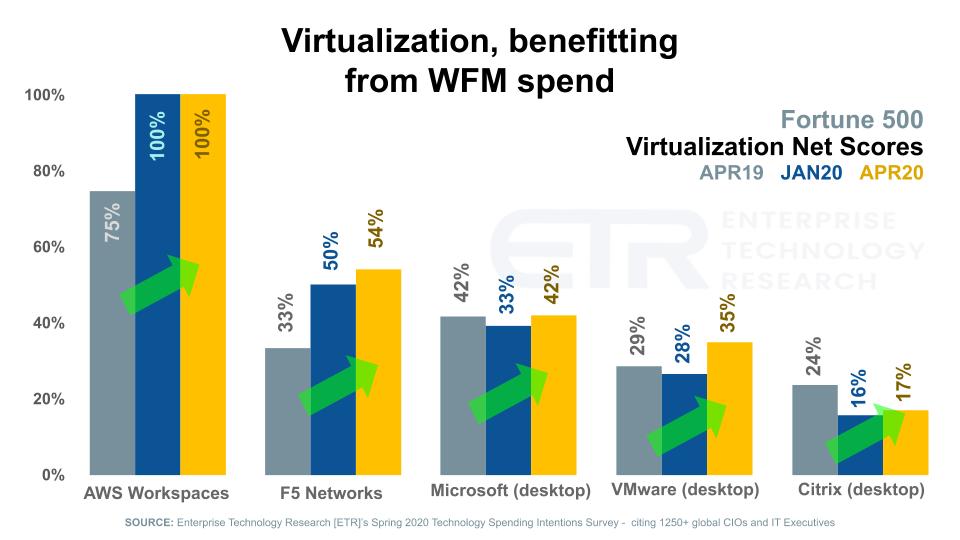
AWS WorkSpaces was first launched in 2013. The initial customer reception was tepid due to strong entrenched players, especially Citrix at the time. However times have changed as you can see in the data below. AWS showing a very impressive 100% Net Score within larger companies.
Notably, the players shown here are all showing positive spending momentum relative to the January survey. Remember, the April survey was taken during the height of the COVID shelter in place order for the US (i.e. from mid- March to mid-April 2020).
Here’s Sagar Kadakia’s take on the VDI data.
Going forward, we plan to focus on infrastructure, analytics data stores, software, automation (for example, robotic process automation) and other sectors, so please tune in for that and as always, let us know if there are sectors you like us to investigate.
Remember these episodes are all available as podcasts wherever you listen.
Ways to get in touch: Email david.vellante@siliconangle.com, DM @dvellante on Twitter and comment on our LinkedIn posts.
Also, check out this ETR Tutorial we created, which explains the spending methodology in more detail.
Here’s this week’s full video analysis:
THANK YOU