


 CLOUD
CLOUD
CLOUD
CLOUD
CLOUD
As we reported in our last update, tech spending overall continues to be significantly muted relative to 2019. We currently project a 4% to 5% decline in 2020 spending and a tepid 2% increase in 2021. Nonetheless, there continue to be bright spots in some sectors and for vendors in an overall challenging market.
In this week’s Breaking Analysis, we welcome back Erik Bradley from Enterprise Technology Research to provide added color to these scenarios.
The following narrative provides a brief overview of the most recent October from more than 1,400 chief information officers and technology buyers in ETR’s latest sample.
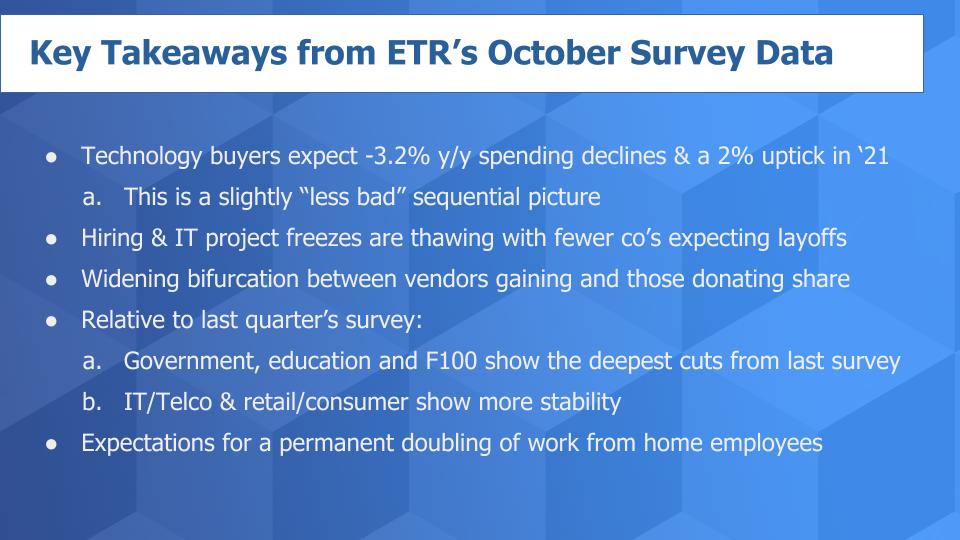
The best news at the macro level is the rate of tech spending declines are compressing heading into Q4 2020. In other words, sequentially, the spending outlook for Q4 is “less bad” than it was in Q3. IT buyers remain cautious and uncertain based on numerous factors accentuated by the U.S. presidential election and of course the continued situation with the coronavirus.
Nonetheless, buyers are adapting to the “New Abnormal” and adjusting business models accordingly. Evidence is seen by the reports from CIOs of a reduction in expected layoffs, hiring freezes and IT project freezes.
The macro picture is not pretty, but several sectors and vendors continue to perform extremely well. Notably, Snowflake, Automation Anywhere, UiPath, Google, Zoom, Redis Labs, Amazon Web Services, Okta and Databricks show elevated Net Scores (spending momentum) near or above the 50% level.
Moreover, spending on Kubernetes-related initiatives remains extremely strong. This is in stark contrast to some of the more challenged names including Teradata, Dropbox, DXC, Rackspace, Veritas, Wipro and Iron Mountain and Polycom, which all show Net Scores at or below 0% – meaning more customers are spending less than those spending more on technologies from these vendors.
Despite the absence of Microsoft on this list, (its overall Net Score is below 50%), the company shows Net Scores that are very strong in several sectors that also show a large market presence. Examples include teams (70%+), Power Automate (~70%), Azure and Azure Functions (60%+). Microsoft continues to be very well positioned in the data set, especially for a company of its size,
On the industry front, government, education and many companies in the F100 continue to report the steepest cuts while IT/telco and retail/consumer are showing clear signs of stability.
As we reported last week, long term, CIOs expect the true work from home base of employees to roughly double from pre-COVID-19 levels (from 16% to 34%).
Here’s Bradley’s summary of the macro conditions.
These conclusions are drawn from ETR’s most recent October survey, the demographics of which are highlighted below.
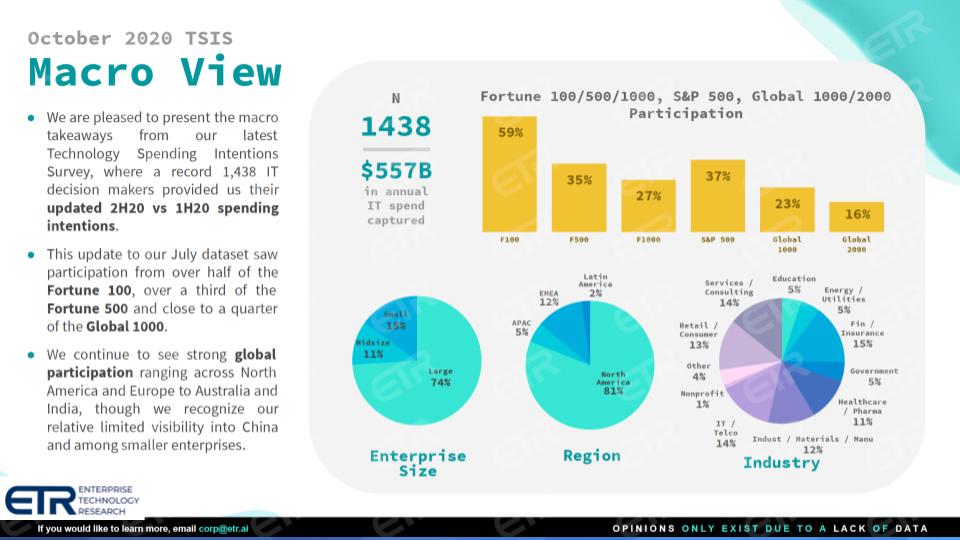
Bradley highlights the critical aspects of the October survey demographics.
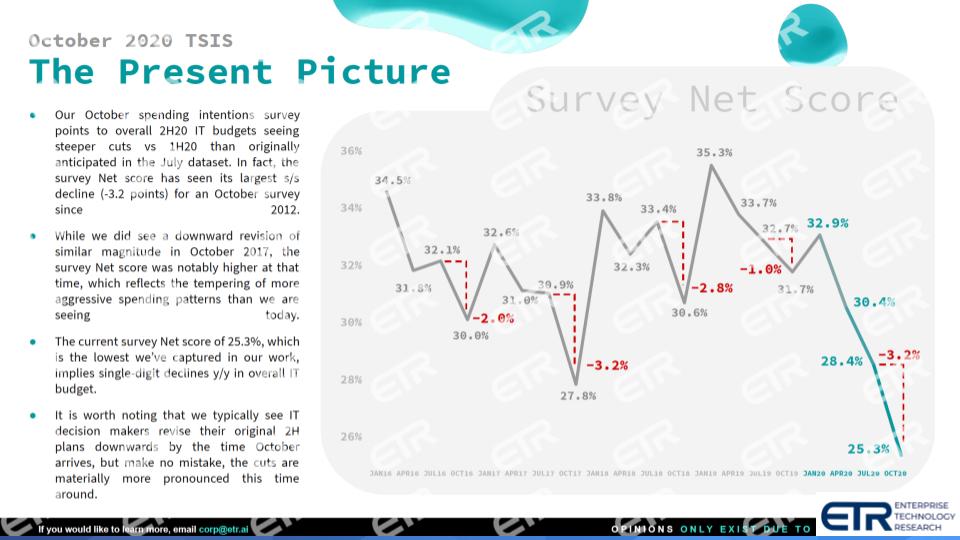
The fourth calendar quarter is often the most productive for vendors as buyers tend to spend later in the year both to lock in year-over-year budget comparisons and to get ready for the following January’s project push. Having said that, it’s not uncommon for ETR’s October survey data to show softness relative to first-half expectations. Nonetheless, as the graphic below shows, aggregate Net Score projections for Q4 2020 are the lowest in the multi-year history of ETR’s survey.
Here’s a detailed conversation with Erik Bradley on interpreting these Net Score variables.
The following graphic shows the sector breakdown comparing Net Scores from the July and October surveys. Only container-related initiatives show positive spending momentum survey over survey.
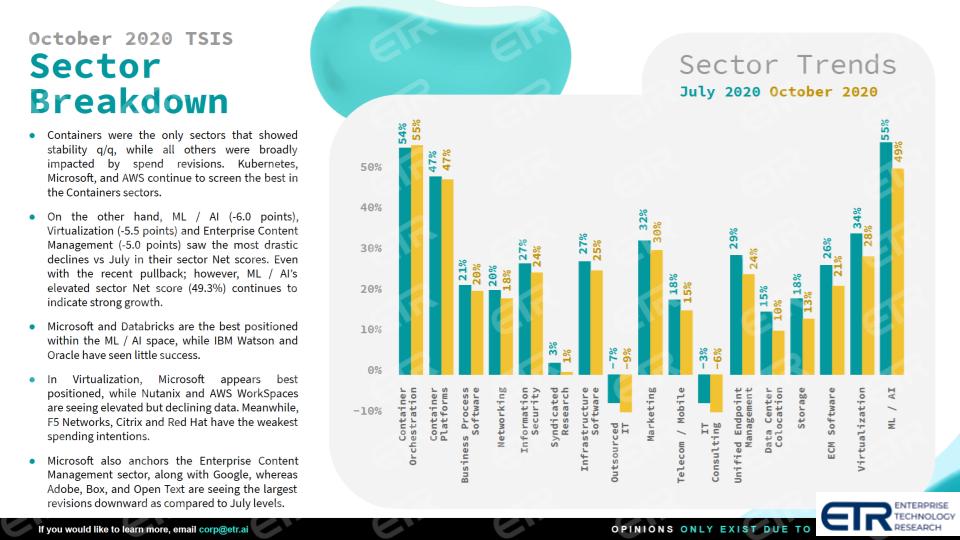
However, as you can see, despite the decline in AI/ML, the category remains elevated. As well, we believe machine learning and machine intelligence are increasingly becoming embedded into applications and won’t show up in the survey as direct spending. Traditional on-premises data center categories such as data center colocation and storage and certain professional services like IT outsourcing and consulting continue to show challenges.
A point about information security: The sector remains strong and though there is some softening survey-t0-survey as in virtually all sectors, there are some real bright spots in cyber, as we’ve highlighted in the past several quarters. Notably, late last summer we started to see accelerated momentum for companies like CrowdStrike Holdings, Okta and Zscaler; and subsequently added SailPoint to that list among others.
Then when COVID-19 hit, we saw additional acceleration and reported that endpoint security, identity access management and cloud security were becoming critical sectors in the work-from-home pivot. We believe we are early in the cycle of a secular trend toward these sectors and vendors and expect this momentum to continue for quite some time – assuming strong execution from the vendors.
Here’s our detailed discussion on the sector graphic above.
Despite being off survey to survey, as the graphic below demonstrates, cloud computing and the RPA/automation sectors continue to show Net Scores at elevated levels.
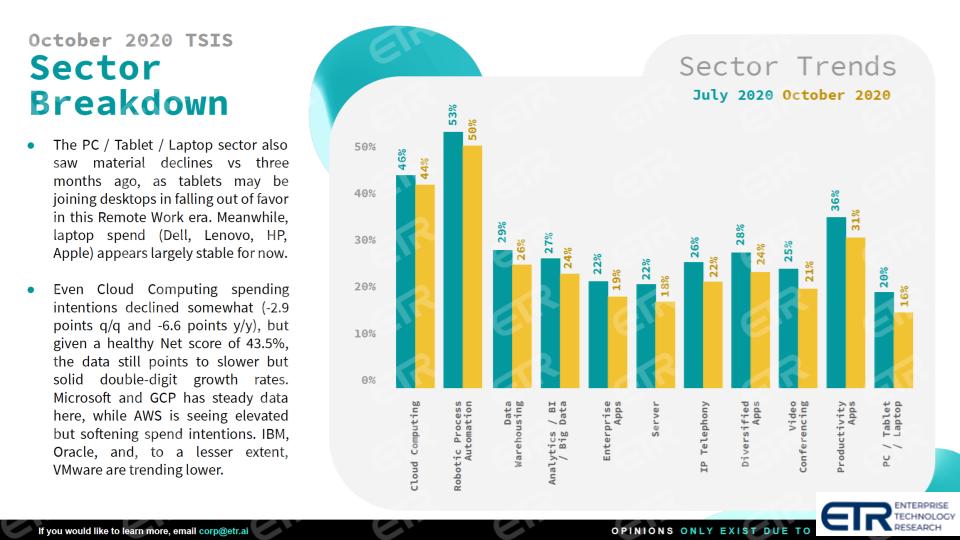
We’ve reported extensively on the cloud computing sector and the area of automation generally and RPA specifically. RPA is a standout for sure. But, as we will show later in this post, cloud computing is particularly impressive because it exhibits both elevated Net Scores and a large market presence. Much is made about AWS’ slowing growth rate, but one has to consider its size and put that in context. The same dynamic is true for the cloud market overall. As a sector in the survey data, it is both pervasive and shows strong spending velocity.
Other points mentioning in the chart above: Although data warehousing might look uninteresting, a company such as Snowflake is buried in those bars and demonstrates momentum that is off-the-charts good. We will dig into this in future segments.
Here’s our detailed narrative on the above graphic.
The next graphic we want to show you is a motion graphic (click to play), and what we’re showing below is one of our favorite views. On the vertical axis you’ve got Net Score. Remember how Net Score is derived. Essentially ETR, every quarter like clockwork, asks customers, Are you spending more or spending less? It’s more granular and sophisticated than that, but essentially ETR subtracts the red (less) from the green (more) and that leaves you with a Net Score. So the higher the net score the better on the vertical axis.
On the on the horizontal is axis is Market Share, which is an indicator of pervasiveness in the dataset. So you want to be up and to the right, of course, like all these charts and XY graphics. And what we’re showing below is, we go back to October 2018 and run the motion through the October 2020 survey.
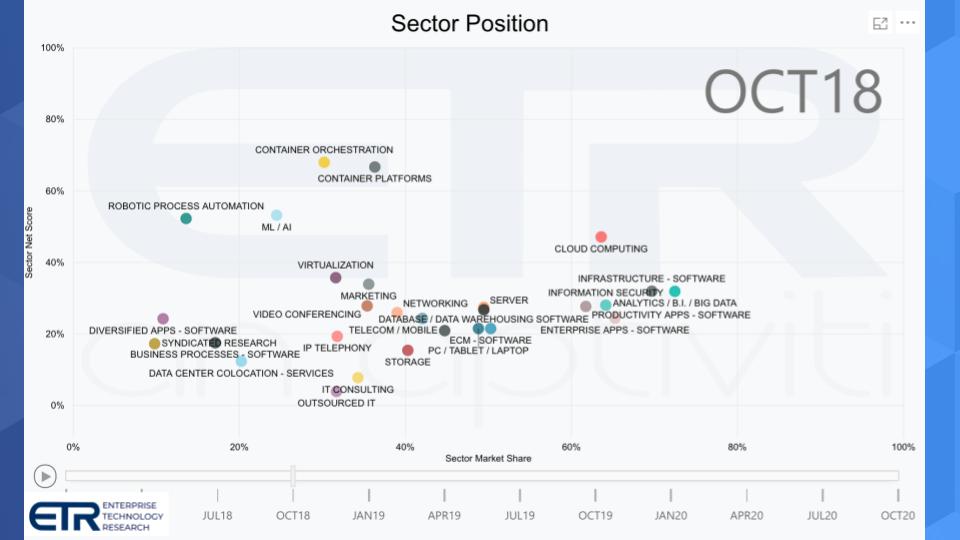
What you see when you set the graphic above in motion is the movement of sectors over time on the X-Y axes.
The following points are noteworthy:
Erik Bradley indicated in our discussion that ETR was finally come out with a real viewpoint on Snowflake now that it’s public. ETR launched with a positive to neutral viewpoint, with absolutely outstanding expansion rates. “All the commentary we get from our CIOs is just incredible, the market share gains are about as high as you’re going to see in the survey, they are extremely well positioned to continue executing, and this is not in the data set, but we also know that that management team is fantastic,” he said. “I would think that they had set themselves up coming out as a public company not to completely disappoint. And everything in our data set shows absolutely no reason why they would disappoint.”
Note: The reason for a neutral rating is twofold: 1) It gives ETR enough time to analyze several quarters of data relative to consensus to do a detailed regression analysis; and 2) Snowflake’s high valuation.
Here are Bradley’s complete comments on Snowflake.
Splunk has been extremely successful and since its ascendency, everyone wants a piece of Splunk’s market. Bradley made several comments on the markets in which Splunk plays and the data suggests the company will face some challenges from competitors in the coming quarters.
Overall, Bradley shared that he recently hosted a panel on the application performance management and monitoring space. He said CIOs believe the market is ripe for disruption and they believe that Elastic and Dynatrace are challenging Splunk’s dominance and pricing models — Elastic especially with an open-source model. We’ve cited Datadog as well as having success in the area.
As well, we discussed several possible disruptors to watch, including Honeycomb, Observe and ChaosSearch, the company Ed Walsh recently joined as chief executive.
Here’s our full discussion on the APM vendors.
Rackspace’s Net Scores are actually deeply negative. To give Rackspace credit, when it was private, it acquired a bunch of different managed service providers, launched the OpenStack project and then tried to align itself with Amazon Web Services and others. But as Eric Bradley indicated, the IPO was not very special. In this environment, with very elevated valuations in technology stocks, having a negative IPO was concerning. And the data supports this negative view, showing softness across several years.
The hope is that its MSP revenue starts kicking in, and possibly that can change the outlook, But for right now the snapshot of the ETR data was quite dire.
Many thanks to Erik Bradley for framing the market with us this week. ETR has exited its quiet period and its private clients have had access to the fresh data for several weeks now. That means that we can begin digging into the data as we do each quarter. We plan to report on several trends and sectors as we usually do, including cloud and cloud native, data and database and analytics, cybersecurity, automation, infrastructure and key software sectors. As well, we will keep our eyes on the macro spending trends and assumptions and we’ll report changes at the margin.
Remember these episodes are all available as podcasts wherever you listen. Also, check out this ETR Tutorial we created, which explains the spending methodology in more detail. Ways to get in touch: Email david.vellante@siliconangle.com, DM @dvellante on Twitter and comment on our LinkedIn posts.
Here’s the full video analysis:
Support our mission to keep content open and free by engaging with theCUBE community. Join theCUBE’s Alumni Trust Network, where technology leaders connect, share intelligence and create opportunities.
Founded by tech visionaries John Furrier and Dave Vellante, SiliconANGLE Media has built a dynamic ecosystem of industry-leading digital media brands that reach 15+ million elite tech professionals. Our new proprietary theCUBE AI Video Cloud is breaking ground in audience interaction, leveraging theCUBEai.com neural network to help technology companies make data-driven decisions and stay at the forefront of industry conversations.