


 CLOUD
CLOUD
CLOUD
CLOUD
CLOUD
Grafana Labs Inc. today debuted the latest major release of its Grafana Cloud monitoring platform with new features and a free tier for cash-strapped information technology departments.
Making monitoring more budget-friendly has lately become a bigger priority for other observability providers as well. Publicly traded New Relic Inc., one of the biggest names in the segment, added a free tier to its platform a few months ago. Startup Logz.io more recently introduced a cost reduction feature called Smart Tiering.
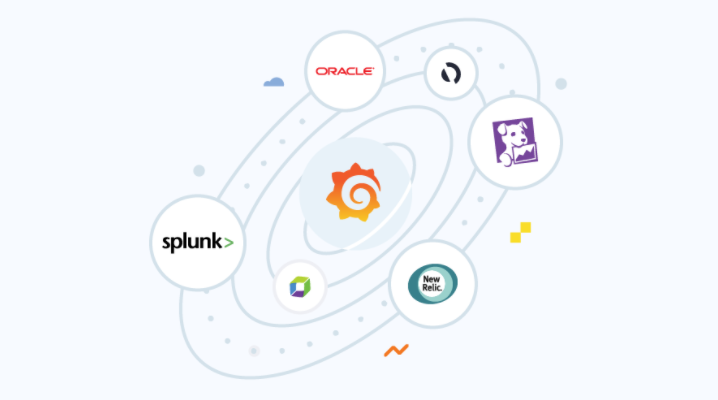
New York-based Grafana Labs is the maker of Grafana, a popular open-source tool for tracking the health of IT infrastructure that’s used by the likes of Intel Corp. and Fermilab. Grafana Cloud, the service being updated, is the startup’s commercial cloud-hosted version of the tool.
Administrators now have access to a synthetic monitoring tool for viewing a system’s health from their users’ point of view. Synthetic monitoring is a technique that simulates user requests to an application in order to see how reliably it operates under real-world conditions. The simulated requests come from software systems that are operated by Grafana Labs and scattered around the world, which allows administrators to simulate traffic from different geographic locations.
Grafana Cloud also includes a new tool dubbed Tempo that uses distributed tracing to troubleshoot problems. Distributed tracing makes it possible to track a request as it travels through an application’s subcomponents pinpoint the specific module responsible for an issue. The method is used to shed light on the inner workings on software container-based workloads, which are difficult to monitor because they can have dozens of individual modules or more.
In the Grafana Cloud interface, Grafana Labs has simplified the built-in alerting feature to make it easier for IT teams to get notified about issues. Administrators can now centrally set up alerting rules for application metrics and logs. Metrics help identify issues such as system performance drops, while logs provide insight into other types of technical problems including failures to process user requests.
The other big changes in the new release affect Grafana Cloud’s pricing. Grafana Labs has updated the service’s entry-level plan with more generous data limits that allow customers to process five times more information streams than before. Additionally, there’s now a free tier that makes the service available to as many as three users inside a company at no charge, with the ability to retain monitoring data for two weeks.
For enterprise software providers, free product tiers can indirectly boost sales by giving potential customers an easy way to try a solution without committing to a big purchase. Offering a scaled-down free version of a product is also a good way to win the business of startups. In the fast-paced tech industry, a startup that may have a limited IT budget initially can quickly grow into a big customer.
THANK YOU