


 CLOUD
CLOUD
CLOUD
CLOUD
CLOUD
We’re seeing the emergence of four, and only four, A players in the market for hyperscale cloud computing services.
For the combined infrastructure as a service and platform as a service market, only Amazon Web Services Inc., Microsoft Corp. with Azure, Alibaba Group Holding Ltd. and Alphabet Inc.’s Google Cloud Platform have the resources, momentum and stamina to outperform all the others — indefinitely.
Combined, we believe these companies will generate more than $115 billion in 2021 IaaS and PaaS revenue. That’s a substantial chunk of market opportunity that is growing in the mid-30% range this year.
In this Breaking Analysis, we are initiating coverage of Alibaba for our IaaS and PaaS market segments. And we’ll update you on the latest hyperscale cloud market and survey data from Enterprise Technology Research.
Amazon.com Inc. and Alphabet reported earnings last week and AWS Chief Executive Andy Jassy was promoted to lead Amazon overall. TheCUBE interviewed John Furrier to get his take on the Jassy move. John has a close relationship with Jassy and a unique perspective on these developments. We simulcast the audio of the interview on Clubhouse and then hosted a two-hour Clubhouse room that brought forth many great perspectives on the topic. Then we took the conversation to Twitter and the conversation turned to the performance of the Big 3 cloud players and their respective positions in the market.
Here’s the tweet that inspired the addition of Alibaba:

This gentleman is a tech journalist out of New Delhi and he pointed out that we were discounting Alibaba. We’re not purposely ignoring Alibaba, we just needed to do more homework on the company and its cloud business.
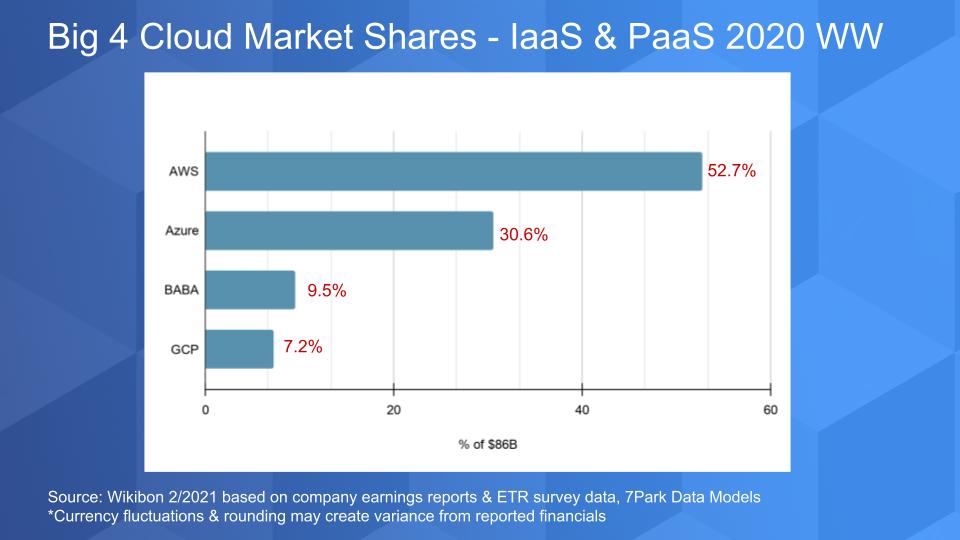
We did some homework. The chart below shows our updated IaaS figures and includes the full year 2020, which was pretty close to our Q4 projections. The big change is we’ve added Alibaba to the data.

These four companies accounted for $86 billion in 2020 revenue, a 41% growth rate relative to 2019. Notably:
We believe that collectively, these four companies will account for more than $115 billion in 2021 IaaS and PaaS revenue.
Google is far behind AWS and Azure despite its high growth rate. Google’s overall cloud business lost $5.6 billion in 2020, which has some people concerned. We, on the other hand, are thrilled because as we’ve reported, in our view Google needs to get its head out of its ads. Cloud is its future and we’re excited that the company is pouring investment into its cloud business. With $120 billion on the balance sheet, we can’t think of a better use of cash.
There is often confusion about the figures we publish. We want to stress that this data represents our best efforts to create an apples-to-apples comparison across all four clouds. Many people ask about how much of these figures reflect Microsoft’s Office 365 or Google G Suite (now called Workspace). The answer is our intention is $0. These are our estimates of worldwide IaaS and PaaS revenue. Some have said we’re too low. Some have said we’re too high. Hey, if you have better numbers, please share them – happy to have a look.
You may be asking, what’s driving this performance for these companies? Our answer is that all four are benefiting from an accelerated shift to digital. But each one has other tailwinds. For example, AWS is capitalizing on its large head start and brand value that it has created. As well, despite the fact that we estimate more than 75% of its revenue comes from compute and storage, AWS’ feature and functional differentiation, combined with its large ecosystem is a driving force of growth for the company.
In the case of Azure, in addition to its captive software estate, the company on its earnings call cited strong growth in its consumption-based business across all industries and customer segments. As we’ve said many times, Microsoft makes it easy for its existing customers to tap into Azure. And terms such as true consumption pricing, with no minimums and the ability to cancel any time, make it extremely attractive to experiment and get hooked. That method has certainly served AWS well over the years.
Now for Google, its growth is being powered by its excellent technology and in particular its prowess in artificial intelligence and data analytics. As well, we suspect that much of the losses in Google Cloud are coming from large go-to-market investments that are paying growth dividends. As Tim Crawford said on Twitter, $6 billion is not too shabby. Also, Google cited wins at Wayfair and Etsy that we believe it’s putting forth to signal that retailers might be reluctant to do business with Amazon. These are two high-profile names, but we’d like to see more wins like these in future quarters to call this a trend.
Although the market for cloud infrastructure certainly comprises more than just four companies, the A players stand alone as hyperscalers with the technology, resources, capital spending budget, customer momentum and heft that make them unique.
The chart below shows the Big 4 market shares in this context:
Among these four:
Let’s now take a look at what the customers are saying in the ETR survey data.
The chart shows XY dimensions with Net Score or spending momentum on the vertical axis and Market Share or pervasiveness in the survey on the horizontal axis. In the upper right you can see the Net Scores and number of mentions for each company.
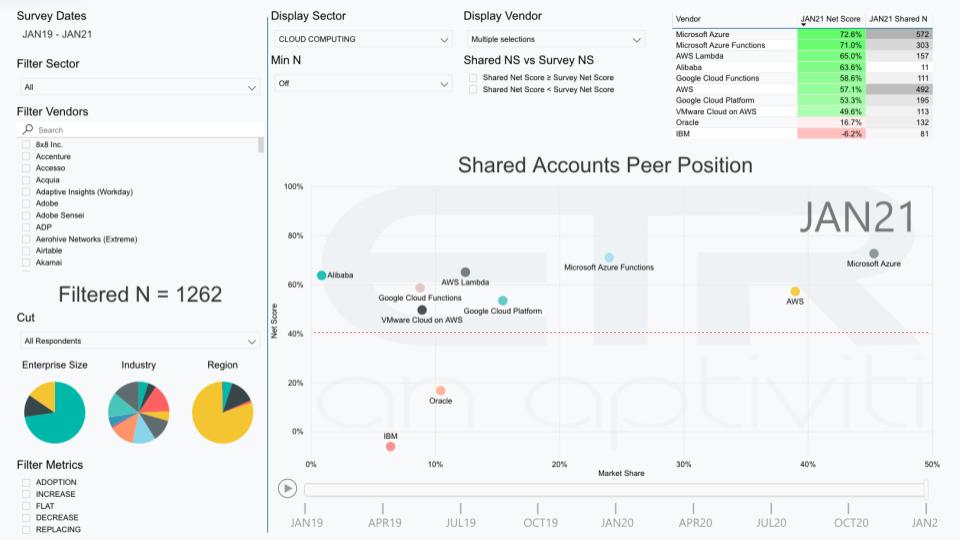
What we’ve done above is cut the January ETR survey data of 1,262 respondents. And we’ve filtered on the data by cloud, meaning the respondents are answering about their use of vendors’ cloud computing offerings only, eliminating any noncloud spend.
Azure is quite amazing to us with a 72.6% Net Score across 572 responses out of the 1,262. AWS is the next most pervasive in the data set with 492 shared accounts and a Net Score of 57.1%. Now you may be wondering why Azure is bigger in the data set than AWS, when we just told you the opposite on the previous market share slide.
The answer is this is a user survey and there are a lot of Microsoft accounts in the sample. And there are likely other anomalies in that the respondent’s notion of cloud doesn’t directly map into our IaaS and PaaS definitions. But the trends are clear and consistent: Amazon and Azure dominate cloud infrastructure spending.
For context we’ve included functions in the form of AWS Lambda, Azure Functions and Google Cloud Functions, because as you can see there’s a lot of spending momentum in these sectors.
You’ll also note that we’ve added Alibaba to this chart with a respectable 63.6% Net Score. There are only 11 shared responses in the data set, so don’t go to the bank on these numbers – but 11 data points is better than 0.
In addition, we’ve added VMware Cloud on AWS on the chart.
The players and offerings above the 40% red dotted lines have clear market momentum, meaning these offerings have strong or very strong spending velocity in the data. More precisely, it means a higher percentage of customers are spending more on these platforms than are spending less.
We hear this frequently and so we’ve put Oracle Corp. and IBM Corp. on the chart. You can see they both have a respectable presence in the data set with 132 and 81 response, respectively. Oracle has a positive Net Score of 16.7% and IBM a negative 6.2%.
What does that mean? It says that among the 132 survey respondents using Oracle Cloud, 16.7% more customers are spending more on Oracle’s cloud than are spending less. In the case of IBM, it says more customers are spending less than spending more. Even though Oracle’s numbers are positive, both companies are in the “red zone” and show far less momentum than the leaders.
We’ve said many times that the good news is that Oracle and IBM at least have clouds. But they are not direct competitors of the Big 4 as hyperscale cloud infrastructure players – they’re just not. They each have a large software business, IBM has a huge services presence (it’s the majority of IBM’s revenue) and they both can migrate customers to the cloud and market hybrid cloud services. Their definition of cloud is most certainly different than that of AWS – which is fine, but both companies use what we call a “kitchen sink” method of reporting their cloud business.
Oracle, for example, includes cloud and license support in its cloud numbers, often with revenue recognition at time of contract with a term that’s renewable, and it also includes on-premises fees for database and middleware. If you want to call that cloud, fine. IBM is just as bad, maybe worse, and includes so much legacy stuff in its cloud number to hide the ball that it’s just not worth trying to unpack for this post. We have previously tried and frankly it’s just not a good use of time.
But as we’ve said, both companies are in the cloud game directly and can make good money provisioning infrastructure to support their respective software and services businesses. We just don’t consider them hyperscale-class clouds, which are defined by the Big 4 and really only those four.
Readers from IBM and Oracle can send hate mail to david.vellante@siliconangle.com.
One important trend we want to unpack is something that came up this week in our Twitter conversation. Below is a tweet from Matt Baker, who heads strategic planning for Dell. He was responding to someone who commented on our cloud data basically asking, “With all that cloud revenue momentum, who paid the price?”
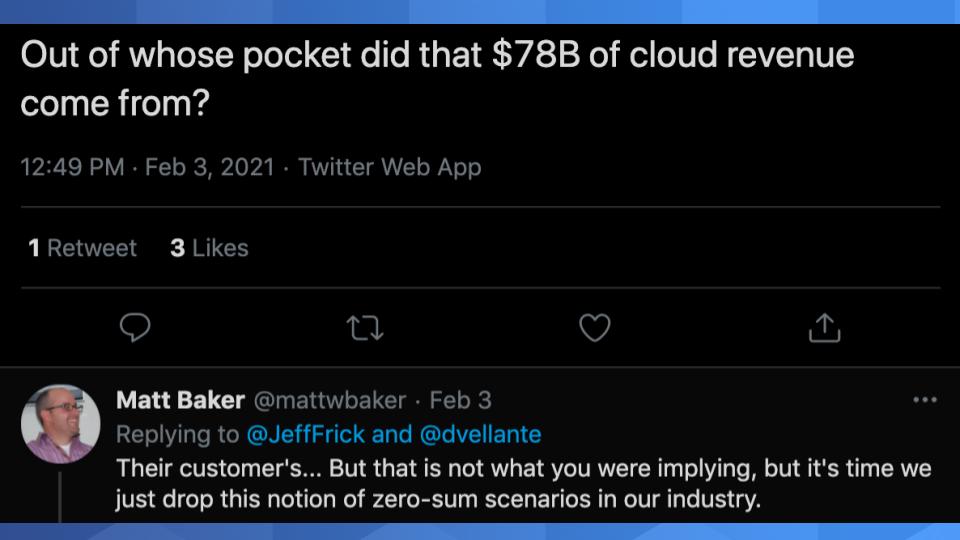
Matt was saying look, this isn’t a zero-sum game. In other words, a dollar of cloud doesn’t translate into a lost dollar from on-prem or legacy firms. So let’s look at that.
First, we would generally agree with Matt Baker: It’s not a one-for-one swap of spend. Here’s some data from ETR that can maybe give us some insight there.
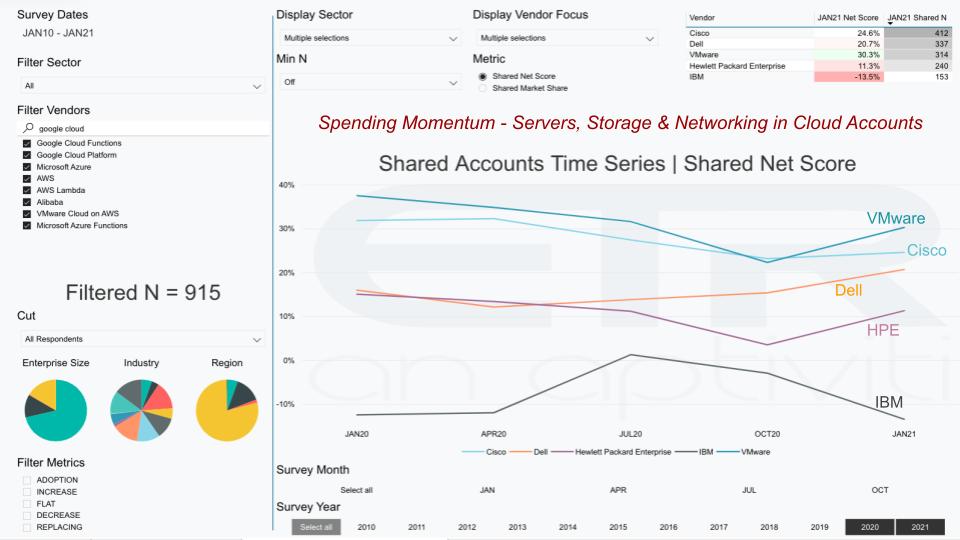
What the chart above shows is a cut of 915 hyperscale cloud accounts. And within those accounts we show the spending velocity or Net Score cut by servers, storage and networking for VMware Inc., Cisco Systems Inc., Dell Technologies Inc., Hewlett Packard Enterprise Co. and IBM for 2020 into 2021.
This is an interesting picture. It shows the Net Scores for the Jan, April, July and October 2020 and the January 2021 surveys. Of course, all the on-prem players were affected by the COVID-19 pandemic. IBM seems to be the counter line – not that it wasn’t affected, but it has this measurable mainframe cycle going on and it’s in a down cycle now. And you can see pretty much all the others are showing upticks headed into 2021, with Cisco kind of flattish but stable and up a bit.
So to Matt Baker’s point, despite the 35% or so growth expected for the Big 4 in 2021, the on-prem leaders are showing some positive signs.
It’s important to dig into this a bit further because we’re not saying cloud hasn’t hurt on-prem spending – of course it has.
Below is the same picture over a 10-year view:
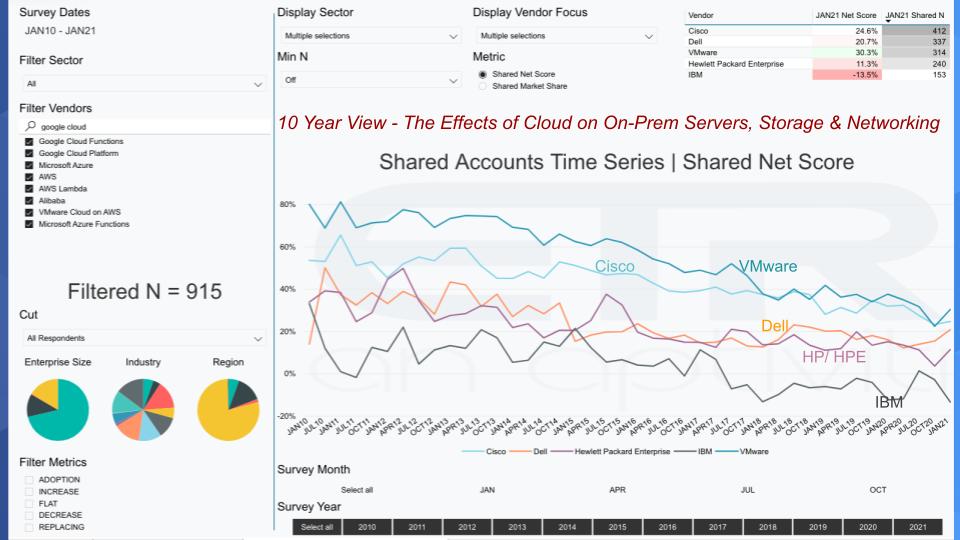
As you can see in the data, there’s been a long steady decline in on-prem spending velocity as a direct result of cloud, and it’s no surprise.
If you think about the prevailing model for servers, storage and networking. Servers have been perpetually underutilized, even with virtualization. With the exception of backup jobs, there aren’t many workloads that can max out server utilization. So we kept buying more servers to give us performance headroom and ran at 20% to 30% utilization.
For storage, same story, maybe worse because for years it was powered by a mechanical system, so more spindles were required to gain performance. And in networking it was a story of “Buy more ports, buy more ports,” so in the case of these segments, customers were forced to plan, fight the chief financial officer for capital expenditures, procure, overprovision and manage in cycles.
Then along comes AWS and says, “Try this on for size: Experiment cheaply. Pay for what you eat. Cancel anytime. Provision programmatically and build new stuff.”
The impact of cloud on these bellwether on-prem infrastructure players is undeniable.
To give a bit more insight and data on this topic, below is a picture of the “wheel charts” from the ETR data for AWS, Microsoft, Google compared with VMware. A wheel chart shows the percentage of customers saying they’ll add a platform new (lime green), increase spend by more than 5% (forest green), spend flat relative to last year (gray), spend less by more than 5% (pinkish) or leave the platform (bright red). Subtract the red from the green and you get the Net Score or NS.
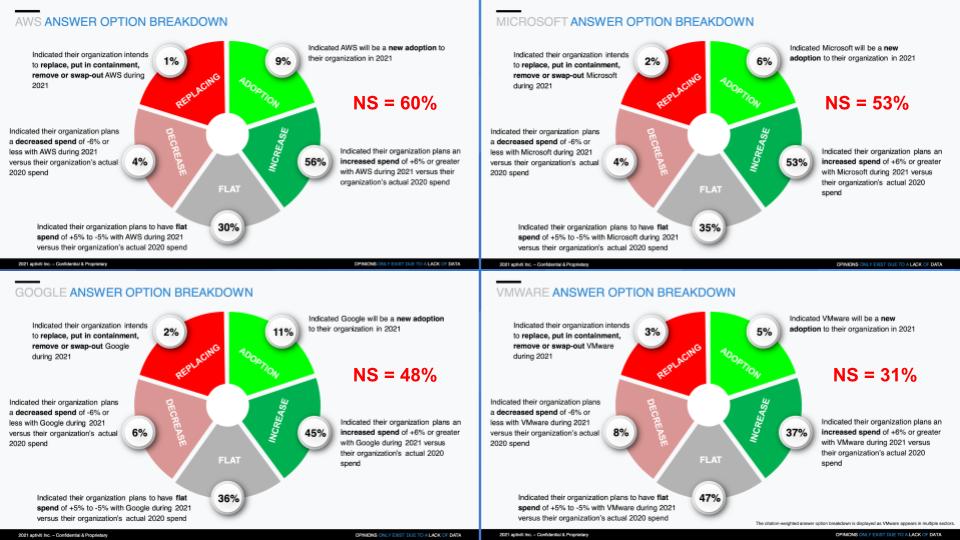
AWS with a Net Score of 60% is off-the-charts good. Microsoft – remember this includes the entire Microsoft business, not just Azure – has really strong performance for such a mature company. As for Google, frankly we’d like to see higher. And VMware is sort of the gold standard of on-prem, so we include them in this mix. You can see strength, but much bigger flat spending, which is common for a mature company.
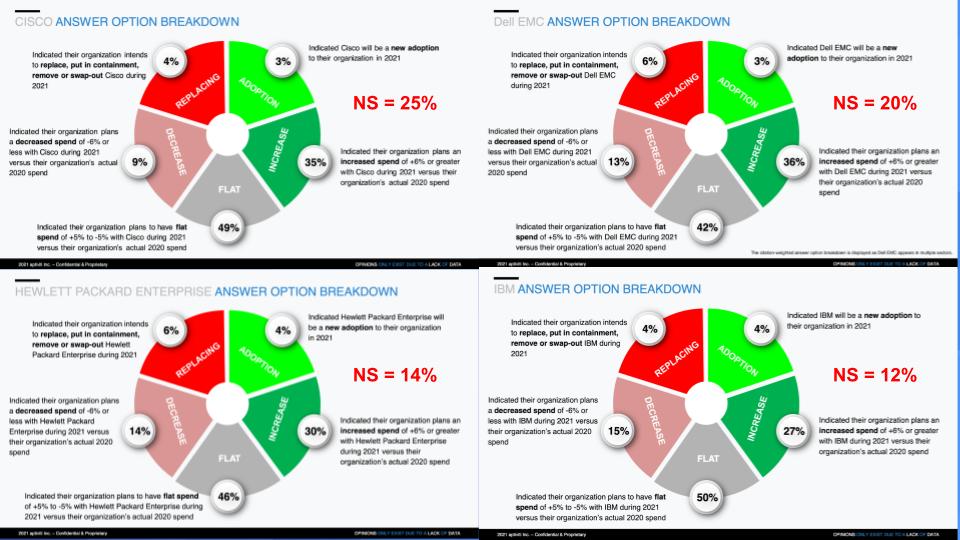
It’s not surprising to see, but the greens go down, the flats go up compared with the cloud guys and the red, which is nonexistent with AWS, goes into the high teens, with the exception of Cisco, which despite its exposure to virtually all industries – including those hard-hit by COVID – shows pretty low red scores.
Although Pure of course is not a mature legacy player, it primarily participates in on-prem markets. Look at the wheel chart below for Pure Storage. We’re not sure what’s happening here, but this is impressive. We’re seeing a big rebound — as you can see, we’ve superimposed a candlestick over time comparing previous quarters’ surveys. Note the huge uptick in the January survey – the blue line highlighted in the red-dotted ellipse – jumping up to a 63% Net Score from below 20% last quarter.
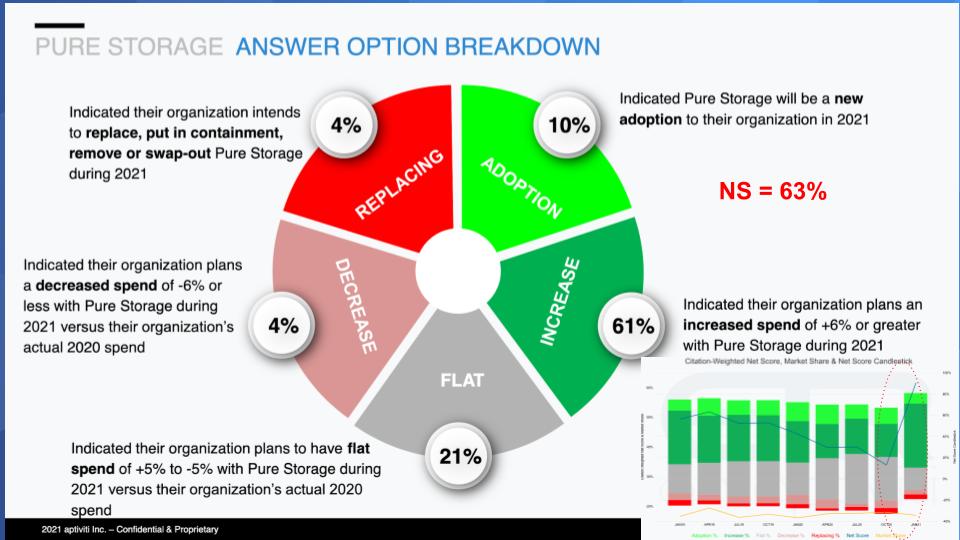
We’ll see how this translates into Pure’s financial results in 2021. Remember, this survey is forward-looking. But we can’t recall ever seeing this much of an uptick for an established company. Maybe it’s pent-up demand or some other anomaly in the data, but we should know within a few months.
The point is, you still see strong action going on in on-prem and hybrid, despite the freight train that is cloud.
The bottom line, coming back to Matt Baker’s point, is there are opportunities that the on-prem players can pursue in hybrid, multicloud and edge — specifically, this idea of building an abstraction layer on top of the hyperscale clouds and letting them build out their data center presence, with the traditional on-prem players adding value on top. The challenge is picking the right spots, moving fast enough and balancing Wall Street promises with innovation. There’s that same old dilemma.
Let’s face it: Amazon could lose tons of money for years and not get killed by the Street. Google has so much cash it can’t spend it fast enough, and Microsoft, after years of going sideways, has finally figured it out and then some. Alibaba is new to our analysis, but it’s like looking at a China version of Amazon. Plus Ant, despite its regulatory challenges with the Chinese government. So all four of these players are in the driver’s seat and they’re leading in not only cloud but AI and the data keeps flowing into the cloud.
We’re still early into the cloud platform era. And it’s morphing from a collection of remote cloud services into a ubiquitous, sensing, thinking, anticipatory system that is increasingly automated, intelligent and hyper-decentralized. One thing’s for sure, the next 10 years will not be the same as the past decade.
Remember these episodes are all available as podcasts wherever you listen. Ways to get in touch: Email david.vellante@siliconangle.com, DM @dvellante on Twitter and comment on our LinkedIn posts. Also, check out this ETR Tutorial we created, which explains the spending methodology in more detail.
Here’s the full video analysis:
THANK YOU