 BIG DATA
 BIG DATA
 BIG DATA
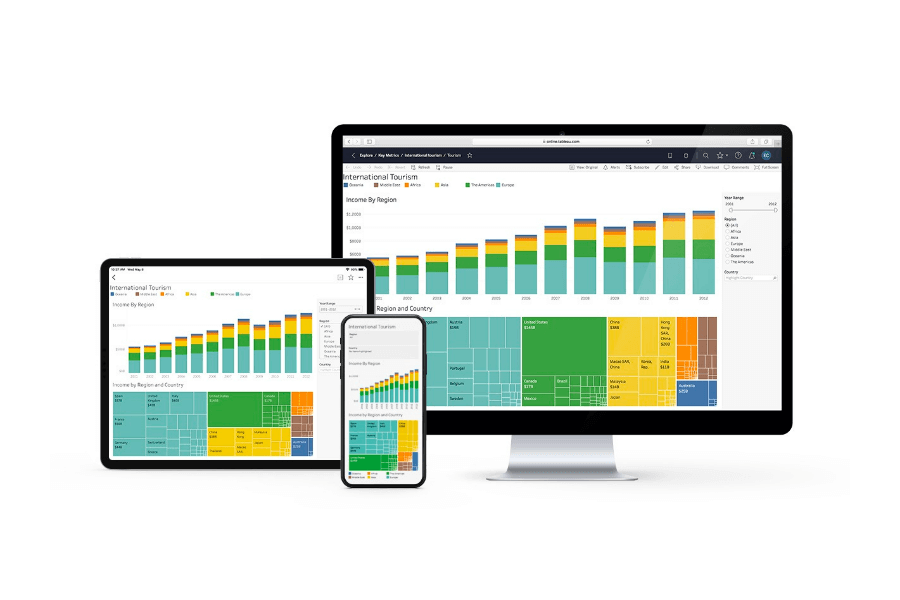
Salesforce Inc.’s data visualization platform Tableau Software is introducing a major update that promises to help customers unlock more data insights, build better dashboards and make more accurate predictions using artificial intelligence.
The new updates were announced today with the Tableau 2022.3 release, with the headline feature the new Data Guide for Tableau dashboards. As the company explained, a new user’s first encounter with a Tableau dashboard can be a confusing experience that leaves them with more questions than answers.
Data Guide is meant to solve that problem, providing descriptions and resources to help get new users oriented and explain how data visibility works. In this way, the company says, users should quickly understand where their data is coming from and how they can interact with it.
Another purpose of Data Guide is to help users derive insights informed by Tableau’s AI features more quickly. When looking at a dashboard, the Data Change Radar feature automatically surfaces unusual changes, while Explain the Viz can help to identify outliers in the underlying data set and the causes behind them. Together, these two features ensure users can spend more time acting on important changes, rather than searching for what caused them.
Today’s release also makes it easier to build more sophisticated dashboards via the new Dynamic Zone Visibility feature. As Tableau explains, dashboards rarely benefit from a one-size-fits-all approach. Yet, it’s also unsustainable and inefficient to create a distinct dashboard for each audience.
Instead, Tableau believes users need a way to see different versions of each dashboard based on what’s most relevant to them. That’s where Dynamic Zone Visibility comes in, giving users a way to programmatically hide and show various dashboard zones. Users can create more sophisticated dashboard experiences without any complex workarounds involved, the company said.
Users not only need to understand their data, but also to transform it to unlock new insights and possibilities. Table Extensions makes it easier to transform, augment, score or otherwise modify data using analytics extensions such as Python, R and Einstein Discovery, Tableau says.
The new features also come to the management side, with the addition of Advanced Management for Tableau Server, which makes it possible to automate the scaling of backgrounder services. As the company explained it, the new capability allows users to remove and add backgrounders based on their needs. And once jobs have been processed, Tableau says, users can remove backgrounders to save on costs, and do it with no downtime.
Advanced Management for Tableau Server also comes with a new Activity Log that helps administrators to provide better tracking of everything that’s going on within users’ Tableau environments, so they can scale up their deployments without adding complexity. With Activity Log, admins can now understand how individual users are employing Tableau. This data can then be documented via a log file to serve up granular insights that can aid in the creation of security and user access policies.
Tableau Chief Product Officer Francois Ajenstat said today’s updates would be helpful for hundreds of companies that, even now, still struggle to unlock value from their own data. “Our investments fuse Tableau in other widely used applications and bring self-service into the flow of work, making insights easier, relevant and more actionable,” he said.
Support our mission to keep content open and free by engaging with theCUBE community. Join theCUBE’s Alumni Trust Network, where technology leaders connect, share intelligence and create opportunities.
Founded by tech visionaries John Furrier and Dave Vellante, SiliconANGLE Media has built a dynamic ecosystem of industry-leading digital media brands that reach 15+ million elite tech professionals. Our new proprietary theCUBE AI Video Cloud is breaking ground in audience interaction, leveraging theCUBEai.com neural network to help technology companies make data-driven decisions and stay at the forefront of industry conversations.