

 CLOUD
CLOUD
CLOUD
CLOUD
CLOUD
Grafana Labs Inc. is releasing two open-source tools designed to help developers make their applications more efficient and resolve software errors faster.
Both tools made their debut at the startup’s annual ObservabilityCON 2022 event today.
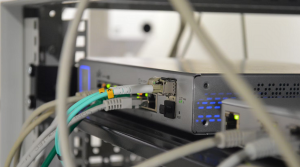
New York-based Grafana Labs is backed by more than $535 million in funding from Sequoia Capital, Coatue and other investors. It develops Grafana, one of the most popular open-source platforms for detecting technical issues in information technology infrastructure. The startup also offers several other open-source tools likewise focused on helping IT teams find and fix malfunctions faster.
Grafana generates revenue by selling commercial versions of its tools that offer additional features, such as expanded cybersecurity controls. Companies can deploy the startup’s software both in the cloud and on-premises.
The first new open-source tool that Grafana Labs debuted today is known as Grafana Phlare. It enables developers to track an application’s processor utilization, memory requirements and other hardware usage metrics. According to Grafana, the data provided by Phlare can help developers identify opportunities to make their software more resource-efficient.
Grafana says that Phlare can measure the resource utilization of individual lines of code in an application. The tool creates multiple copies of the application data it collects, which means that no information is lost in the event of an outage. Organizations can store the collected data in public cloud storage services such as Amazon Web Services Inc.’s Amazon S3 platform.
“These days, companies really care that they are able to be online, that their applications are performing fast, that their users aren’t getting annoyed and switching to a competitor,” said Grafana Labs co-founder and Chief Executive Officer Raj Dutt. “The experience and the quality of that online experience is of paramount importance to everybody. So making sure all the software and infrastructure is running, and running properly, is top of mind for every company.”
Phlare is rolling out alongside Grafana Faro, the second open-source tool that Grafana introduced today. Faro is designed to help developers find any technical issues that may affect an application’s interface. The tool collects technical data about potential malfunctions and makes it available through a centralized monitoring dashboard.
Usually, collecting data about errors in an application requires developers to add significant amounts of so-called instrumentation code to the application’s code base. Grafana says that Faro simplifies the process. According to the startup, the tool can be deployed in a few seconds with two lines of code.
Faro collects multiple types of technical data about an application’s interface. It can collect logs, data points that describe specific events such as outages, as well as information about code errors and application performance. The tool provides the option to send the collected data to Grafana Labs’ namesake IT infrastructure monitoring platform for analysis.
Support our mission to keep content open and free by engaging with theCUBE community. Join theCUBE’s Alumni Trust Network, where technology leaders connect, share intelligence and create opportunities.
Founded by tech visionaries John Furrier and Dave Vellante, SiliconANGLE Media has built a dynamic ecosystem of industry-leading digital media brands that reach 15+ million elite tech professionals. Our new proprietary theCUBE AI Video Cloud is breaking ground in audience interaction, leveraging theCUBEai.com neural network to help technology companies make data-driven decisions and stay at the forefront of industry conversations.