 CLOUD
CLOUD
 CLOUD
CLOUD
 CLOUD
CLOUD
Amazon Web Services Inc. today introduced a new application management tool, myApplications, that will help customers find ways of operating their cloud workloads more cost-efficiently.
The tool also lends itself to other use cases. According to AWS, administrators can leverage myApplications to track workloads’ hardware usage and scan them for potential cybersecurity weak points. Additionally, the tool displays data on potential technical issues from another newly introduced feature, Amazon CloudWatch Application Signals, that also made its debut today.
One of the main target use cases for myApplications is helping customers track the costs associated with their cloud workloads. Optimizing cloud costs was a major theme of Amazon.com Inc. Chief Technology Officer Werner Vogels’ keynote today at AWS re:Invent 2023, where myApplications was announced. Vogels presented a set of seven best practices, dubbed “The Frugal Architect,” that companies can implement to avoid unnecessary cloud expenses.
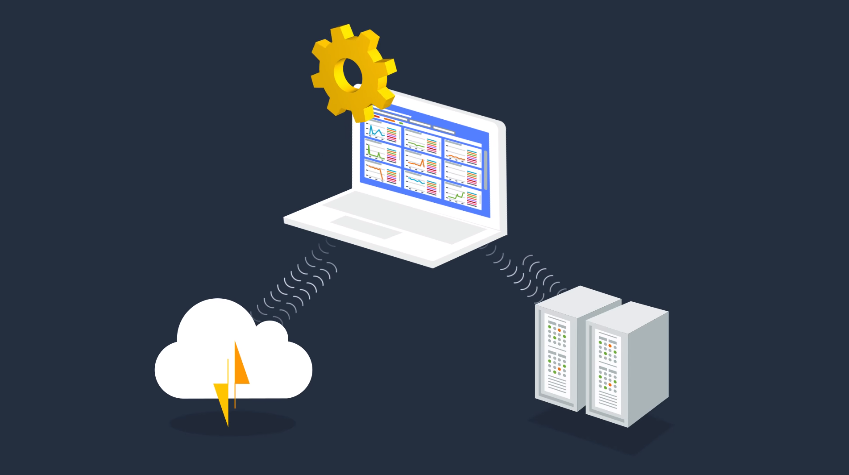
The myApplication interface displays a list of all the workloads in a company’s AWS environment. After selecting one of the workloads, administrators can bring up a dashboard that visualizes what hardware resources and AWS services it uses, as well as how much they cost. The dashboard might, for example, show that the Amazon RDS database in which an application keeps its records accounts for 20% of its monthly cost.
Administrators also have access to higher-level spending data. The myApplications interface displays the total costs an application has incurred since the start of a given month, as well as information on whether those costs are higher or lower than in the previous month. According to AWS, this data can help administrators spot unexpected jumps in spending that may require troubleshooting.
“The Cost and usage widget visualizes your AWS resource costs and usage from AWS Cost Explorer, including the application’s current and forecasted month-end costs, top five billed services, and a monthly application resource cost trend chart,” AWS principal developer advocate Channy Yun detailed in a blog post. “You can monitor spend, look for anomalies, and click to take action where needed.”
The tool is likely to draw interest among the many AWS customers who have been actively trimming cloud costs in recent months to offset macroeconomic pressures. In an exclusive interview ahead of re:Invent, AWS Chief Executive Adam Selipsky told SiliconANGLE that customers’ cost optimization efforts are now mostly complete. He said the focus is now shifting to new cloud workloads such as generative artificial intelligence models.
Tracking costs is not the only task the new myApplications tool promises to ease. It also allows organizations to monitor several other aspects of their cloud infrastructure.
According to AWS, a built-in cybersecurity dashboard displays if a company’s workloads have insecure configuration settings. The dashboard collects data on configuration issues using an existing service called the AWS Security Hub. Another dashboard displays information on application health and performance from CloudWatch Application Signals, a new tool that Vogels introduced during today’s keynote.
Collecting diagnostics data from an application requires equipping it with so-called instrumentation code. Deploying that code can be a time-consuming process, particularly in complex container workloads that comprise a large number of software modules. AWS says CloudWatch Application Signals automates the process and allows developers to set up an application monitoring workflow with a few clicks.
The tool tracks several operational metrics about each workload it monitors. It displays an application’s availability, the number of requests it receives and the latency with which those requests are processed. Administrators can optionally configure the tool to monitor for specific events, such as if a workload’s latency exceeds a certain threshold.
An interface panel called the Service Map displays the individual software modules that make up a workload. It visualizes dependencies, or cases where one application component depends on another to work. If administrators identify a technical issue in one of the components, they can use the tool to access detailed technical data about the incident.
“Application Signals automatically correlates telemetry across metrics, traces, logs, real user monitoring, and synthetic monitoring to speed up troubleshooting and reduce application disruption,” AWS senior developer advocate Veliswa Boya explained in a blog post.
CloudWatch Application Signals is available in preview as part of AWS’ CloudWatch observability service. The myApplications tool, in turn, is generally available through the AWS Management Console.
Support our mission to keep content open and free by engaging with theCUBE community. Join theCUBE’s Alumni Trust Network, where technology leaders connect, share intelligence and create opportunities.
Founded by tech visionaries John Furrier and Dave Vellante, SiliconANGLE Media has built a dynamic ecosystem of industry-leading digital media brands that reach 15+ million elite tech professionals. Our new proprietary theCUBE AI Video Cloud is breaking ground in audience interaction, leveraging theCUBEai.com neural network to help technology companies make data-driven decisions and stay at the forefront of industry conversations.