 AI
AI
 AI
AI
 AI
AI
KubeCon is a simultaneous celebration and solemn assessment of open-source advancement over time. A major theme at this week’s event is MultiKueue, an artificial intelligence-driven project that helps manage distributed workloads across multiple clusters.
MultiKueue and OpenTelemetry are two such initiatives enabling AI models to queue tasks efficiently, particularly across multicloud environments.

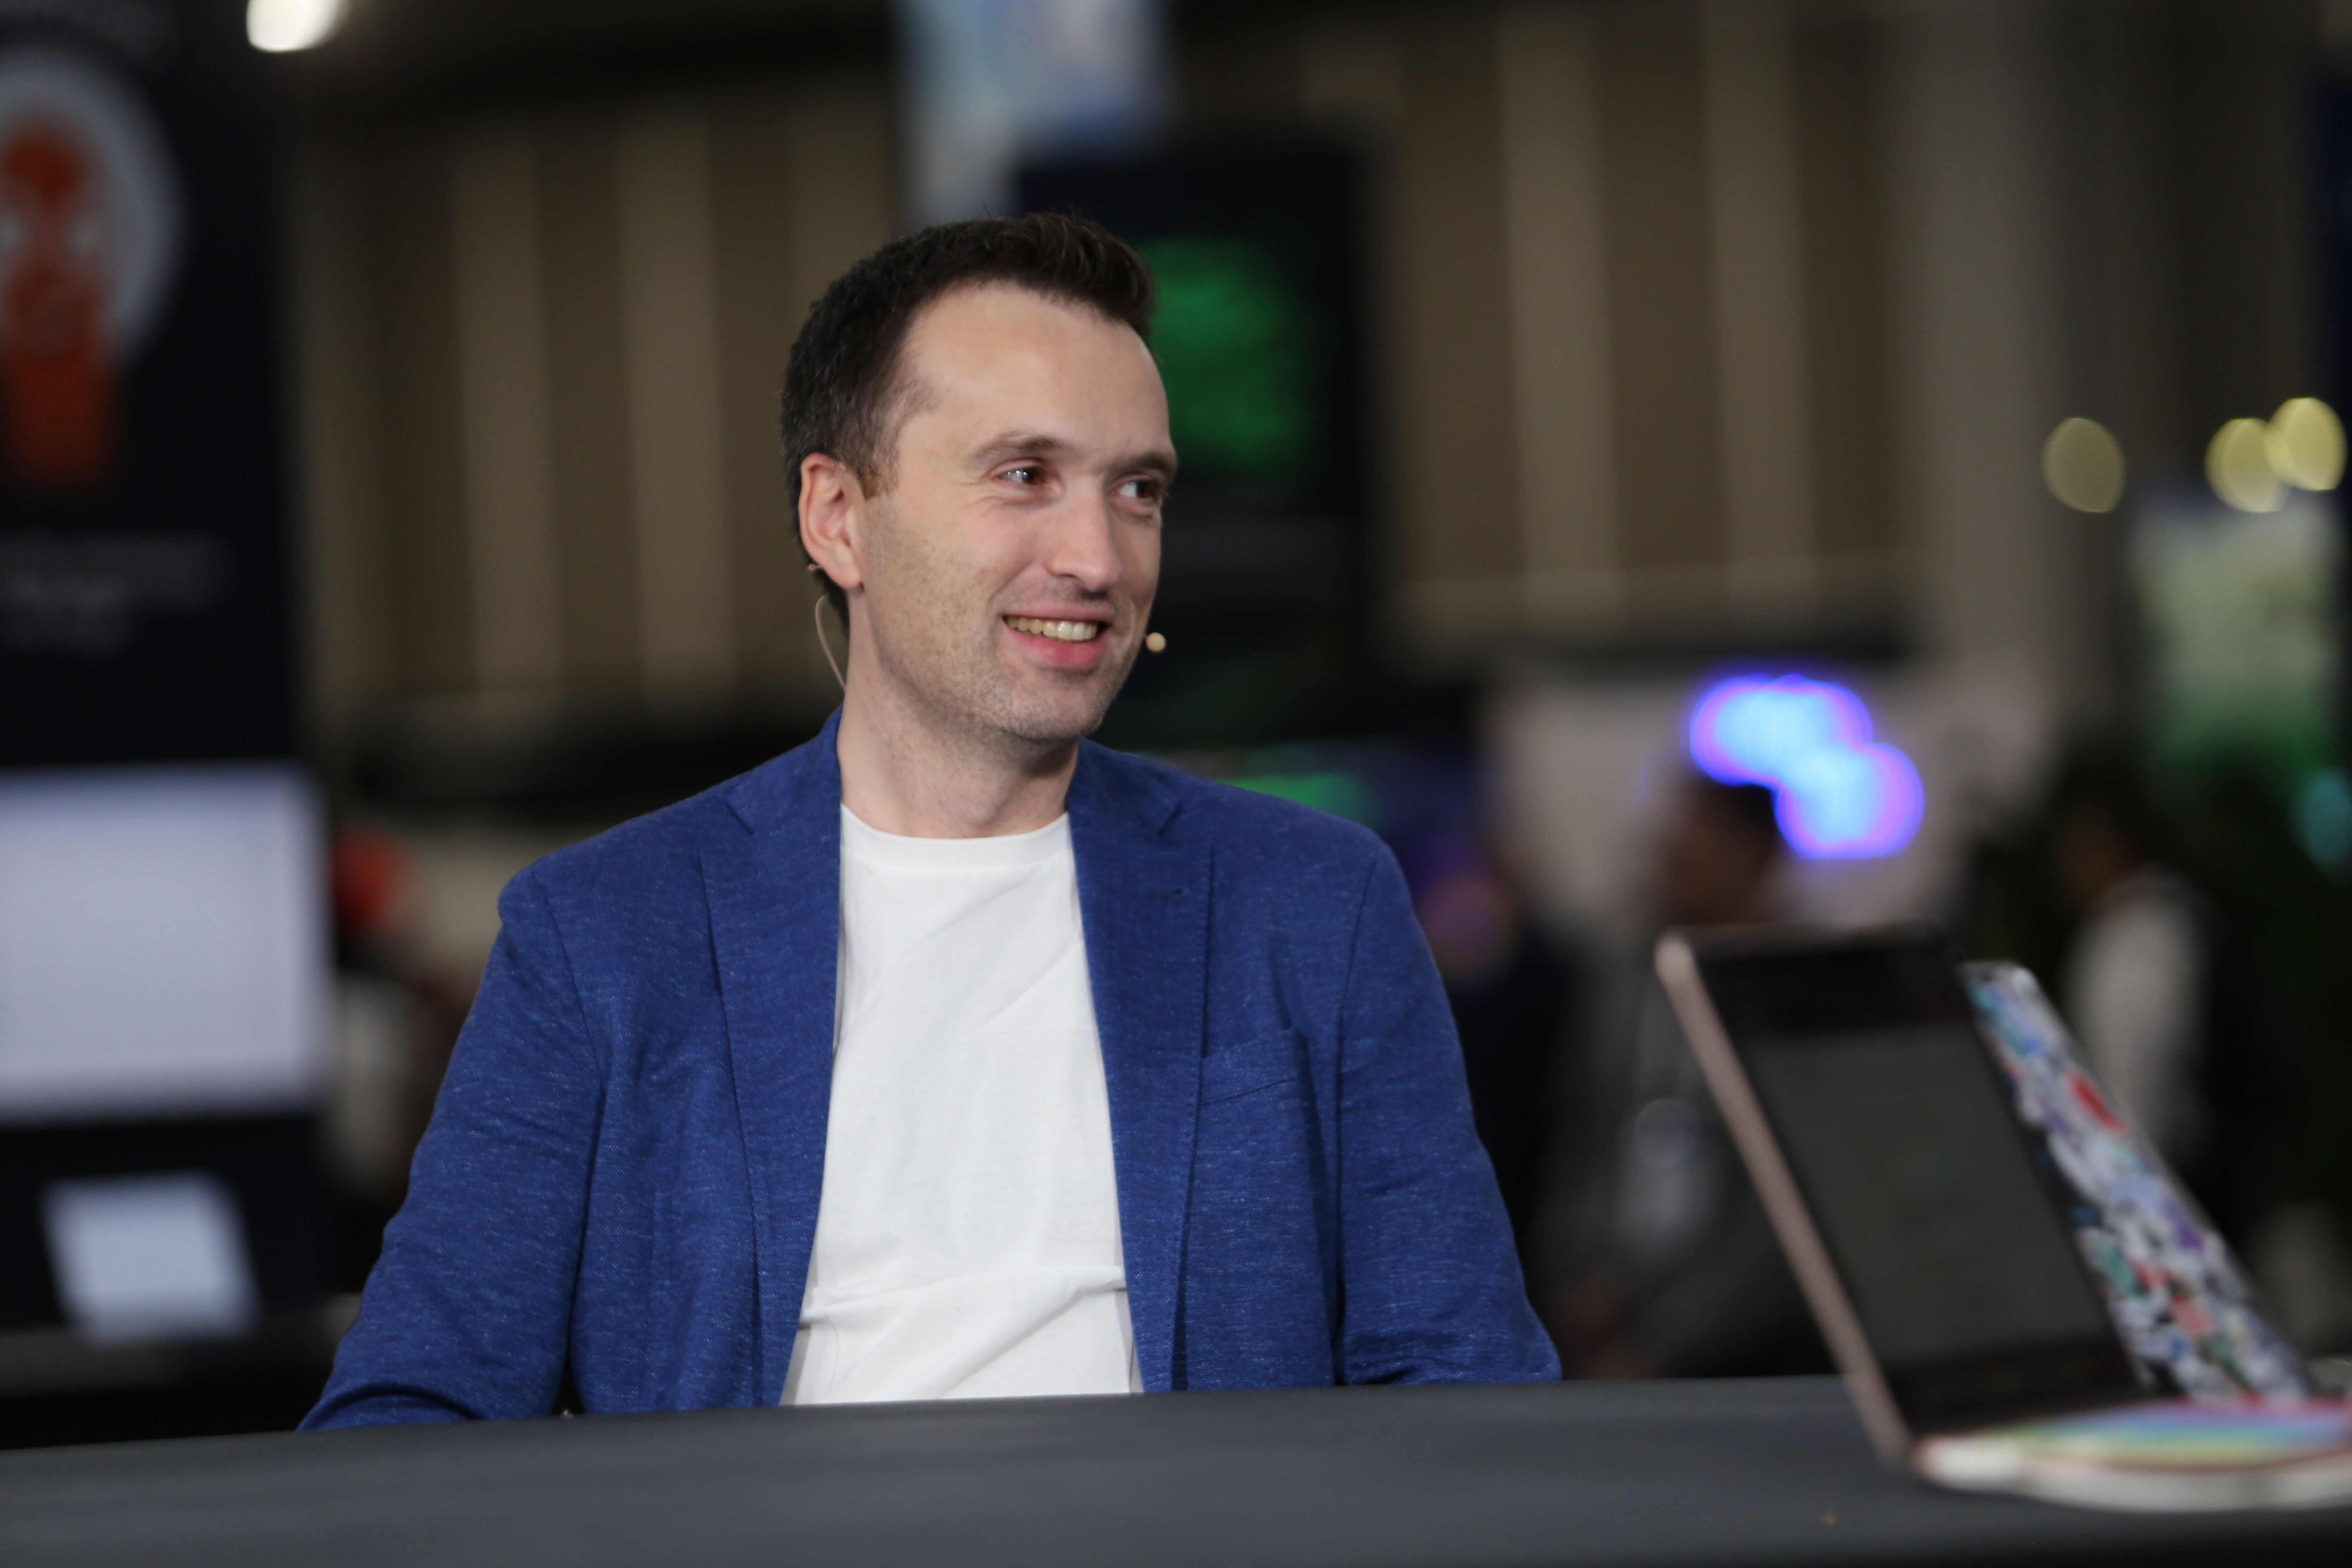
Splunk’s Morgan McLean discusses observability innovations with theCUBE.
“There’s lots of things happening in OpenTelemetry,” said Morgan McLean (pictured), OpenTelemetry co-founder and senior director of product management at Splunk. “I think in the last year or two the adoption of the project has taken off. When we started OpenTelemetry, if you told me it would be as widely used across whole swaths of the market as it is today, I would’ve been a little skeptical that it would be so rapidly adopted. Yet we see major banks, airlines and businesses that are only relatively early in their Kubernetes adoption journey already diving into OTel and adopting it widely, which is very exciting for us.”
McLean spoke with theCUBE Research’s Savannah Peterson and Rob Strechay at KubeCon + CloudNativeCon NA, during an exclusive broadcast on theCUBE, SiliconANGLE Media’s livestreaming studio. They discussed MultiKueue and OpenTelemetry as a step forward in distributed AI and cluster management, signifying the growing demand for solutions that enable workload distribution across diverse and expansive architectures. (* Disclosure below.)
Profiling represents the newest phase in observability innovation, and OpenTelemetry plans to introduce this feature in the coming year. Unlike traditional monitoring, profiling allows teams to examine their applications’ performance at the function level, giving insights into inefficiencies in real time, according to McLean.
“Everyone knows what logging is, everyone knows what monitoring is, everyone knows what tracing is,” he said. “You talk about profiling, and the only people who sort of know what it is are ones where their bill is on the order of like $50 million a month for compute. That always irked me, and I love working on it. It’s really exciting to me, being able to look at your code and understand which functions within your code are costing you a ton of money is powerful and exciting.”
With profiling in OpenTelemetry, organizations of all sizes will soon have the tools to catch inefficiencies without the need for custom-built solutions. For developers, profiling offers an unprecedented view of their code’s impact on resource usage, enabling faster, more cost-effective optimizations, according to McLean.
“You can profile stuff at development time, but for a large production system, you can never emulate its load properly on a single box, or even run it,” he said. “[Profiling] gives you insights that you have no other way of capturing for real workloads, and you can save tons of money with it.”
Here’s the complete video interview, part of SiliconANGLE’s and theCUBE Research’s coverage of KubeCon + CloudNativeCon NA:
(* Disclosure: TheCUBE is a paid media partner for the KubeCon + CloudNativeCon NA. Neither Red Hat Inc., the headline sponsor of theCUBE’s event coverage, nor other sponsors have editorial control over content on theCUBE or SiliconANGLE.)
Support our mission to keep content open and free by engaging with theCUBE community. Join theCUBE’s Alumni Trust Network, where technology leaders connect, share intelligence and create opportunities.
Founded by tech visionaries John Furrier and Dave Vellante, SiliconANGLE Media has built a dynamic ecosystem of industry-leading digital media brands that reach 15+ million elite tech professionals. Our new proprietary theCUBE AI Video Cloud is breaking ground in audience interaction, leveraging theCUBEai.com neural network to help technology companies make data-driven decisions and stay at the forefront of industry conversations.