


 NEWS
NEWS
NEWS
NEWS
NEWS
 An infographic is a cool way to impart knowledge, especially if you’re dealing with a lot of boring facts, huge numbers, and incomprehensible data. They’re colorful and fun that’s why there’s a lot of them floating around the web from infographics about Batman, obesity, geeks, marriage, dating, and yes, even about infographics.
But aren’t those hard to make? And you need to be really creative and good with designs to be able to make one, right? Piktochart says no.
Magic Piktochart
Yep, the name sounds like something that would come out of a Poké Ball but it’s the new app from Piktochart that makes it fun and easy to create your very own infographic of say, what it takes to create the perfect burger.
Piktochart launched in March 2012 and started with about 1,000 users. Now, Piktochart has 170,000 users ranging from students to professors, the media, and even professionals as its a cool way to present stuff to your boss.
It has a brand new app called Magic that allows Google to crawl over the javascript, so that your infographic can also appear on Google search, infographics become more interesting with interactive tabs and charts, and putting images and icons is better than ever because of it high-powered image editor.
“Piktochart is the infographic tool for non designers.”
So how do you access the power of Magic Piktochart?
New users or those who used the free version in the past need to create a new account. The sign up process takes about 15 seconds and you don’t even need to enter your credit card info to start making your infographic. For those with Pro or paid Piktochar accounts, you need to click on this link, https://magic.piktochart.com/users/password/new, put in your old e-mail address or the one you used for the old Piktochart, click retrieve, then follow the instructions to reset your password. Note that none of your existing or saved infographics will be transferred to your Magic Piktochart account.
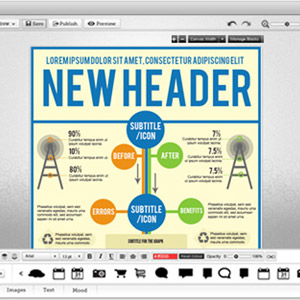
There are 77 themes that you can choose from, but free users can only use six of those. To start creating your infographic, just select a theme to load which will open the infographic so you can edit the icons, images, images, background, and moods. Click on the preview button to see how your infographic looks like and if satisfied, click on the File button to save or save as your infographic.
Piktochart claims that you can make your own infographic in just 30 minutes, but of course, that would only be possible if you have all the data you need ready.
NOTE: Piktochart is a tool to help you create infographics, it doesn’t actually create them for you.
THANK YOU