


 Emerson Network Power’s “2013 State of the Data Center” illustrates that global dependence on everything digital is pushing IT to the forefront of the organization. In fact, a recent Data Center Knowledge article reports Google’s unprecedented level of spending ($7.35 billion in capital expenditures) on data center expansions in 2013. And, according to IO’s George Slessman, 2014 is the year the data center will rule.
Indeed, the innovative future of data storage involves creating bigger, better, and more efficient information storage facilities. To help parse out relevant statistics and information on data storage, we’ve put together a collection of the 10 best data center infographics across the internet. Take a look at the following visual representations of the evolving data center to better understand its impact on the IT industry in the past, present, and future.
.
 The data center. Featuring state-of-the art technology, multiple millions of square feet of space, the requirement of holding billions of pieces of business and customer information. What goes into data center infrastructure? Think about rooftop arrays of solar panels generating as much as 4.5 megawatts of power. Lightning prevention systems that detract strikes from a 300 foot radius. Structures designed to withstand a category 5 earthquake.
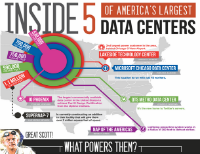
Check out Wikibon’s infographic , highlighting some of the innovative information behind five of North America’s largest data centers.
.
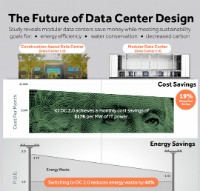 While modular data centers design aren’t yet commonplace, they’ve captured the attention of facilities and IT managers seeking to squeeze even more energy efficiency out of mission-critical IT infrastructure. The IO infographic compares the environmental footprints of a conventional data center versus one that uses modular design.
.
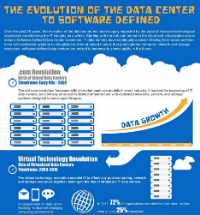 NetApp has released an infographic that chronicles the birth of the software-defined data center. Describing it as an “evolution”, the infographic highlights milestones starting with the siloed data centers of the 90’s up to present day hybrid clouds, as well as its prediction for the future.
.
 The State of Cloud Storage in 2013 infographic offers benchmark data (i.e., performance, availability, errors, etc.) for Microsoft Windows Azure, Amazon, HP, Rackspace, and Google.
.
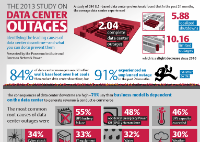 Presented by the Ponemon Institute and Emerson Network Power, this infographic identifies the leading causes of data center downtime—and what you can do to prevent them.
.
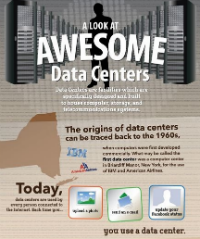
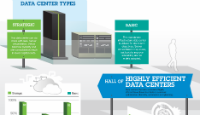 IBM surveyed more than 300 clients across 25 industries and seven countries to see what makes a data center efficient, reliable, and optimal in today’s rapidly changing landscape. See how the infographic analyzes the findings in a visual format.
.
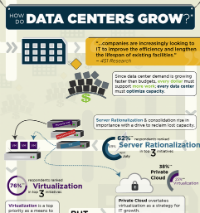 This infographic shows the results of a poll of IT pros who responded to questions about how they were optimizing their data centers with respect to server consolidation, virtualization, and private cloud strategies. Specifically, respondents answered the question: “How do data centers grow?”
.
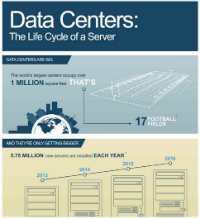 Servers don’t live that long, so what happens to them when their work is done? This infographic, courtesy of Sims Recycling Solutions, illustrates the tremendous number of servers that data centers go through each year. What happens to all that hardware when its short lifespan is reached?
.
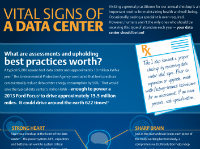 Visiting a general practitioner for our annual checkup is an important routine for maintaining health and well-being. Occasionally, seeing a specialist is even required. However, humans aren’t the only ones who should be receiving this type of attention each year—your data center should be too! Emerson asks what assessments and upholding best practices are worth in this infographic on a data center’s vital signs.
.
 Ever wondered about the inside track on the data centers that power your favorite web services? This infographic takes a closer look at the world’s most impressive data centers.
.
The above list represents a fraction of the data center infographics in the IT space. What’s missing from our list? Which infographics would you add to yours? We’d love to hear your feedback in the comments section below.
THANK YOU