


 BIG DATA
BIG DATA
BIG DATA
BIG DATA
This is a sponsored post commissioned by Hitachi Vantara Corp. Sponsored posts are paid content that appear on all pages of SiliconANGLE.com, supporting editorial efforts. For pricing and inquiries, email sponsor@siliconangle.com.
Today’s automobiles have more processing power than a 1990-era mainframe. Teletrac Navman US Ltd. finds innovative new ways to put that data to work for companies that own fleets of cars, trucks and heavy equipment.
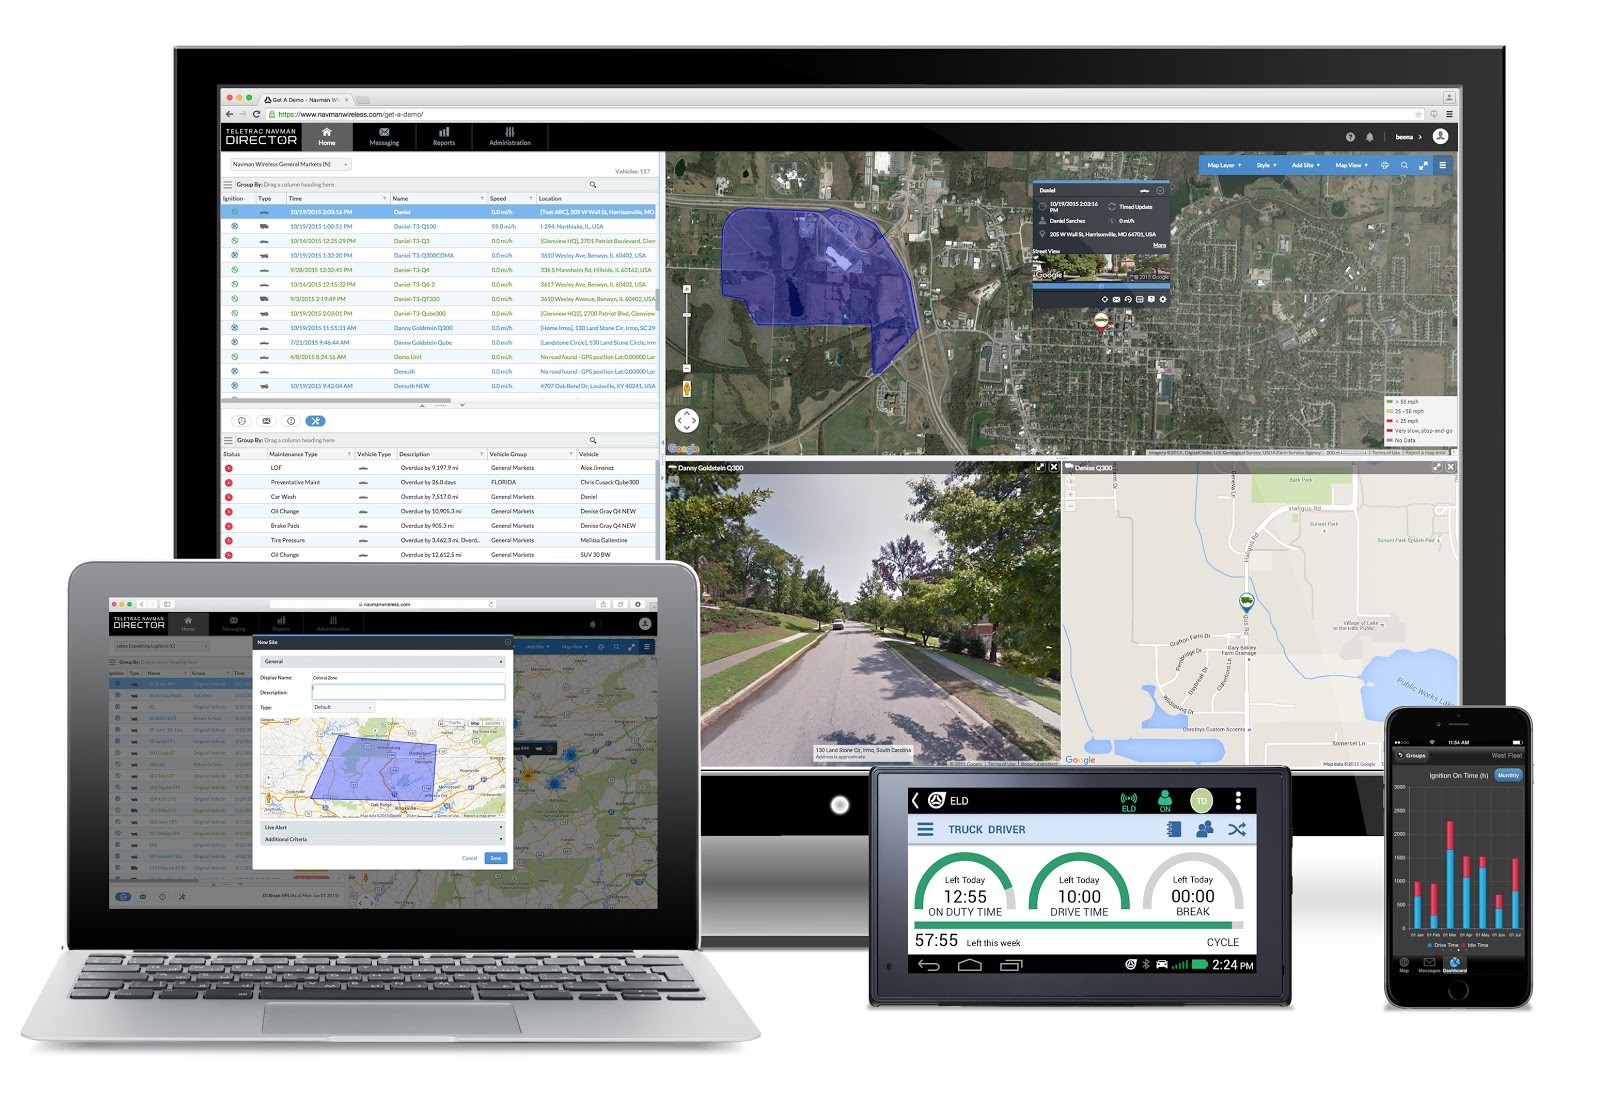
The California-based fleet tracking and management software company’s software-as-a-service solution taps into the information that streams in from sensors embedded in cars, trucks and heavy equipment to help owners improve things like fuel economy, route efficiency, maintenance costs and safety. Teletrac Navman, tracks more than 500,000 vehicles owned by 40,000-plus organizations on six continents, making it one of the world’s largest fleet management providers.
Recently, the company has turned to Pentaho’s data integration and visualization technology from Hitachi Vantara to give its customers unprecedented flexibility to customize their own views of data. Although this self-service component is still rolling out, early feedback from customers has been overwhelmingly positive, creating a foundation for Teletrac Navman to continue to pull away from its competitors based upon performance and predictive analytics.
Teletrac Navman’s technology may be leading edge, but it’s customers are more interested in outputs than algorithms. “They’re good at getting things from point A to point B, and they want to know how to reduce fuel costs, keep drivers safer and avoid problems that could jeopardize the brand,” said Michael Bloom, Teletrac Navman’s director of product management for business intelligence.
Teletrac Navman uses a black box solution installed in each vehicle to gather critical data about performance. Its telematics system tracks location and travel path, and connects to in-vehicle centers for other data such as speed, ignition state, fuel consumption and emissions. It can monitor temperature in refrigerated trucks, tell whether a driver’s seat belt is connected and whether the lights have been left on. “We can connect to anything that emits a digital signal,” Bloom said.
Real-time information and built-in two-way communications enables fleet owners to manage their vehicles and drivers on the fly. For example, Teletrac Navman can alert them when a truck is driving too fast, braking too hard or deviating from its scheduled route. Supervisors can contact drivers while they’re on the road and reroute them or alert them if their fuel consumption is too high.
Compliance with rules and regulations is a major concern for companies. Teletrac Navman provides connected workflow solutions along with real-time and historical data so customers can be sure they and their drivers are compliant with regulations such as the Electronic Driver Log. Dispatchers have at-a-glance visibility into which drivers have available hours and which are in in-violation or rest status.
Data from the road can be integrated with a connected workflow management system that delivers even more insight into how efficiently the business is operating. For example, a signed customer work order for plumbing services can generate an entry in the scheduling system that automatically adds the job to a plumber’s work route the next day.
Event data is gathered roughly once a minute and passed to the cloud at the end of each day. Customers then get detailed reports that help them make smarter decisions about improving efficiency. The individual data points may not be significant on their own, but across fleets of hundreds or thousands of vehicles, the costs add up. “We provide illumination to insights that could otherwise go unnoticed by customers. We provide that much-needed visibility into what’s happening in the field,” Bloom said.
In the case of heavy equipment, the costs can be substantial even for a single machine. They can have different maintenance needs depending on whether they are idling or actively in use. “You need to know exactly how many hours the bulldozer is running and how many hours it’s pushing dirt, because it can cost up to $25,000 to change the oil on some types of heavy equipment,” Bloom said.
All those sensors generate a lot of data, and even with nearly 100 standardized reports, Teletrac Navman was unable to keep up with demand. “Customers told us they love the reports, but they wished they could customize them,” Bloom said. Until recently, that meant custom programming. Developers would scramble to meet customers’ individual reporting needs, but in the process put aside more strategic work on core systems. “It was time consuming for us and created delay for our users,” he said.
The solution would need to support self-service visualizations, fluidly transform data and integrate with the company’s existing technology. “That limited the partner options for us to a small subset,” Bloom said. Teletrac Navman settled on Hitachi Vantara for its ability to provide embedded solutions that combine data transformation with visualization in self-service dashboards made it stand out from the pack.
Particularly important to the selection of Hitachi Vantara was the transformation element. Data from equipment sensors arrives in a lot of different formats: degrees Celsius, pounds per square inch, flow rates, miles and geographic coordinates, to name just a few. That data needs to be not only normalized but combined in interesting ways such as air pressure by miles driven. “We needed to be able to easily process and standardize that data to present it in a meaningful way,” Bloom said. “Hitachi Ventara helped us do that.”
Visualization makes it easier for customers to spot trends and derive new insights. About two-thirds of people are visual thinkers, meaning they wrestle to make sense of rows and columns of data. When that same information is encapsulated in heat maps, bubble charts, stem-and-leaf displays, scatter plots and bar charts, amazing new observations are possible.
One particularly useful feature of the self-service analytics dashboard is the ability it gives customers to manipulate data directly from within visual elements. “You can construct and deconstruct the visual as you go by including or excluding data or drilling down on data points from within the chart,” Bloom said. Multidimensional visualizations enable fleet managers to explore several factors at once. For example, both the color and size of data points on a heat map can be varied to see three dimensions of data instead of just two. Scatter charts, which place many data points on an X/Y axis, usually with a trend down the middle, can immediately pinpoint outliers. “You might be happy that your fleet is getting 90 percent utilization, but a scatter chart will show the three specific vehicles that are bringing your average down,” he said. “Fix that problem and you could be at 99 percent.”
With the new dashboards in place, customers are finding that they come up with new ideas for ways to combine data now that they can view it graphically. “They start with what they think they want and then realize it’s something else that they really want,” Bloom said. Users are also more likely to share visualizations than rows and columns of data. Training has been straightforward, with most customers comfortable enough to build some initial reports after about a one-hour introduction.
Now that Hitachi Vantara is rolling out across Teletrac Navman’s global customer base, the company is finding new ways to apply analytics to its business. The data transformation capabilities make it possible for the company to aggregate and normalize data at the global level for the first time. That means it can address the needs of new and larger customers.
“Next up is real-time processing, predictive analytics and an expanded set of customer use cases. Thanks to data integration and visual analytics, customers are seeing the potential to transform their businesses,” Bloom said.
“We’re moving from walking to running, from analytics to predictive analytics,” Bloom said. “Once customers can see everything that’s going on under the hood, they’re going to want to know how it impacts their future and how they can change that.”
And that’s when the “internet of things” really gets interesting.
THANK YOU