


When the FCC released its 2009 Broadband Performance report last year, it concluded that broadband providers were delivering only half their advertised broadband performance to consumers. This set off a media firestorm of outrage. Websites like ArsTechnica declared that the FCC report confirmed fears that consumers were being ripped off. I pointed out that the FCC conclusions on broadband performance were flawed because the report relied on comScore data that included performance factors that were admittedly outside the control of broadband providers.
Sole reliance of the comScore data didn’t make sense because there was far more accurate data available from Ookla. Soon after the release of the 2009 FCC Broadband Performance report, data from Ookla refuted the FCC’s report. Because Ookla conducts performance measurements from over 6 million unique visitors per month and they poll those visitors about their broadband price and advertised performance, they had a far more extensive pool of data to analyze. The Ookla data showed that U.S. broadband providers on average delivered 93% of their advertised “up to” maximum performance, which is far above the 83% OECD average or even the 86% APEC average. This was in sharp contrast to the 50% score given in the 2009 FCC broadband performance report.
Now the FCC has released its “Measuring Broadband America” 2011 report and it is more in line with with Ookla’s data. The 2011 FCC broadband performance report was based on a study of 10,000 participants conducted by Sam Knows and it largely vindicates most ISPs of the bad rap given to them by last year’s FCC Broadband Performance report. Table 1 below shows a more detailed breakdown.
| Actual Sustained Speed (Mbps) | Advertised Speed (Mbps) | Provider | Actual vs Advertised |
| 0.6 | 0.768 | AT&T | 78% |
| 1.24 | 1.5 | AT&T | 83% |
| 2.34 | 3 | AT&T | 78% |
| 4.71 | 6 | AT&T | 79% |
| 11.1 | 12 | AT&T | 92% |
| 16.07 | 18 | AT&T | 89% |
| 21.1 | 24 | AT&T | 87% |
| 7.47 | 15 | Cablevision | 50% |
| 20.83 | 30 | Cablevision | 69% |
| 1.35 | 1.5 | CenturyLink | 90% |
| 2.6 | 3 | CenturyLink | 87% |
| 4.52 | 5 | CenturyLink | 90% |
| 8.34 | 10 | CenturyLink | 83% |
| 12.04 | 12 | Charter | 100% |
| 16.29 | 18 | Charter | 91% |
| 21.46 | 25 | Charter | 86% |
| 1.44 | 1 | Comcast | 144% |
| 5.97 | 6 | Comcast | 99% |
| 12.13 | 12 | Comcast | 101% |
| 14.1 | 16 | Comcast | 88% |
| 19.59 | 20 | Comcast | 98% |
| 22.57 | 22 | Comcast | 103% |
| 3.2 | 3 | Cox | 107% |
| 11.98 | 12 | Cox | 100% |
| 13.6 | 15 | Cox | 91% |
| 17.21 | 20 | Cox | 86% |
| 20.65 | 25 | Cox | 83% |
| 2.02 | 3 | Frontier | 67% |
| 9.05 | 10 | Insight | 91% |
| 9.07 | 12 | Mediacom | 76% |
| 1.22 | 1.5 | Qwest | 82% |
| 4.83 | 7 | Qwest | 69% |
| 10.45 | 12 | Qwest | 87% |
| 16.96 | 20 | Qwest | 85% |
| 0.73 | 0.768 | TimeWarner | 95% |
| 1.9 | 2 | TimeWarner | 95% |
| 6.49 | 7 | TimeWarner | 93% |
| 9.13 | 10 | TimeWarner | 91% |
| 13.13 | 15 | TimeWarner | 88% |
| 0.69 | 0.768 | Verizon (DSL) | 89% |
| 0.97 | 1 | Verizon (DSL) | 97% |
| 1.32 | 1.5 | Verizon (DSL) | 88% |
| 2.43 | 3 | Verizon (DSL) | 81% |
| 5.02 | 7 | Verizon (DSL) | 72% |
| 10.24 | 10 | Verizon (Fiber) | 102% |
| 17.41 | 15 | Verizon (Fiber) | 116% |
| 22.78 | 20 | Verizon (Fiber) | 113% |
| 28.77 | 25 | Verizon (Fiber) | 115% |
| 40.42 | 35 | Verizon (Fiber) | 115% |
| 1.15 | 1.5 | Windstream | 77% |
| 2.66 | 3 | Windstream | 89% |
| 5.17 | 6 | Windstream | 86% |
| 9.56 | 12 | Windstream | 80% |
Derived from Figure 2 from FCC’s “Measuring Broadband America” 2011 report
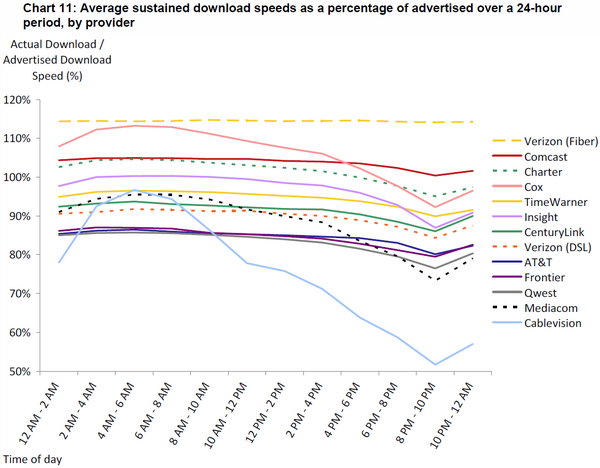
This new report makes a distinction between older Verizon DSL technology and Verizon “FiOS” Fiber to the Home (FTTH) technology. It does not break down Fiber to the Node (FTTN) technology used by Telco providers like AT&T U-verse and Qwest/CenturyLink but we can deduce that the service tiers above 6 Mbps for from these Telcos are FTTN. The report found that most ISPs can sustain data throughput over a 24-hour period at 80% t0 115% of their advertised speeds. The newer DOCSIS 3, U-Verse, and FiOS technologies deliver between 90% and 115% which is a great trend.
The older DSL technologies typically delivered between 72% to 90% of their advertised performance. Cable DOCSIS technologies can typically deliver 95% to 113% of their advertised performance with the exception of CableVision which drops to 50% between 8PM to 10PM. Verizon “FiOS” FTTN technology seemed to be extremely over-provisioned and they consistently deliver 115% of advertised performance any time of the day. FTTN technology was not specifically mentioned but AT&T’s U-verse service seemed to deliver around 90% of their advertised maximum. In my personal experience which differs a little from the report, 6 Mbps U-verse service delivered 7 Mbps.
Source: FCC’s “Measuring Broadband America” 2011 report
Some will question whether the 80-90 percent sustained throughput delivered by ISPs is good enough, but the sustained throughput is not what is being advertised by the ISPs. ISPs advertise the “up to” maximum performance of their service, which does not mean “average performance” or “minimum performance”. As long as the delivered broadband performance in the U.S. is reasonably close to the advertised maximum performance, the anger against the ISPs is misplaced. Other than the somewhat poor worst case results for Cablevision, most of the ISPs look good. Now that the latest FCC data vindicates most of the ISPs, it’s time we gave credit where credit is due.
[Cross-posted at High Tech Forum]
Support our mission to keep content open and free by engaging with theCUBE community. Join theCUBE’s Alumni Trust Network, where technology leaders connect, share intelligence and create opportunities.
Founded by tech visionaries John Furrier and Dave Vellante, SiliconANGLE Media has built a dynamic ecosystem of industry-leading digital media brands that reach 15+ million elite tech professionals. Our new proprietary theCUBE AI Video Cloud is breaking ground in audience interaction, leveraging theCUBEai.com neural network to help technology companies make data-driven decisions and stay at the forefront of industry conversations.


