


 NEWS
NEWS
NEWS
NEWS
NEWS
As if keeping tabs on how the different workloads in a data center interact wasn’t already difficult enough, Hadoop has another layer of dependencies among its internal components. The recently-funded OpsClarity Inc. hopes to simplify the monitoring of the analytics framework with a new iteration of its performance tracking software that adds support for all the key elements under the hood.
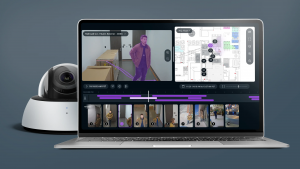
One of the biggest selling points touted by the startup is an automated discovery function capable of quickly mapping out the entire operational puzzle without manual input. The pieces are then brought together in a graphical view that groups related componentry and color-codes every section according to its operational status. A fully-functional server group is thus displayed in green, while problematic elements are marked either yellow or red depending on the severity of the issue.
A timeline feature at the bottom of the OpsClarity console enables administrators to replay an outage in order to trace back how failures cascaded among the different parts of their Hadoop deployments. After finding the source of the problem, they can pull up a dashboard that displays the necessary diagnostics information along with relevant performance metrics. For instance, the software could be configured to show the latency history of a Spark cluster used to support real-time queries, or visualize the amount of free disk space on a server running MapReduce.
OpsClarity says that its platform now also works with databases such as MongoDB and Cassandra that are commonly used in conjunction with Hadoop. They’re joined on the list by the likewise free Elasticsearch query engine and a number of other complementary tools from the open-source ecosystem. According to the startup, the broad reach and automated functionality of its platform can make it easier administrators to keep track of their analytics clusters than traditional alternatives that require operational metrics to be manually visualized.
Support our mission to keep content open and free by engaging with theCUBE community. Join theCUBE’s Alumni Trust Network, where technology leaders connect, share intelligence and create opportunities.
Founded by tech visionaries John Furrier and Dave Vellante, SiliconANGLE Media has built a dynamic ecosystem of industry-leading digital media brands that reach 15+ million elite tech professionals. Our new proprietary theCUBE AI Video Cloud is breaking ground in audience interaction, leveraging theCUBEai.com neural network to help technology companies make data-driven decisions and stay at the forefront of industry conversations.