


 NEWS
NEWS
NEWS
NEWS
NEWS
The big data-oriented visualization and analytics company Qlik (Qliktech International Inc.) has announced the release of its Qlik Playground for developers, a web-based environment that provides an easy way for developers to experiment with Qlik’s powerful platform.
With Playground, developers will be able to quickly prototype analysis and visualizations for large data sets with access to the powerful QIX Associative Indexing Engine with open application programming interfaces (APIs) and a software development kit (SDK).
The Qlik Analytics Platform is a powerful big data analysis engine with open APIs designed to work with any software architecture or stack, platform and language. In turn, the platform provides a wide variety of visualizations driven by its underlying engine in the form of charts, graphs, number tables, bubble charts and other visual aids for understanding data.
By signing up for the Qlik Playground, developers gain access to their own sandbox to design, develop and model big data visualization projects. Qlik hopes that this web environment platform will give developers a chance to see how easy it is to use the platform to do big data visualization and to develop their own visualizations in less time.
“Qlik Playground is opening up a whole new world for developers with common Web development skills that are not proprietary or require product-specific development training,” said Speros Kokenes, director of visual analytics at axis group, a Qlik partner. “User interfaces and charts are not limited to product constraints but instead are open to our imagination on how to best support customers’ specialized needs.”
Founded in 1993, Qlik’s first mission was to build software to mimic human experience when digesting and displaying data. The company has since gone on to build a powerful business intelligence engine designed to provide query-less data access and relationship analysis that the Qlik Playground taps into.
At Big Data NYC 2015, Anthony Deighton, chief technology officer and senior vice president of products at Qlik, told SiliconANGLE’s theCUBE in an interview: “The problem isn’t a data-visualization problem only, but there is a whole set of work behind that to make that data available.”
Analyst group Wikibon, owned by the same company as SiliconANGLE, predicts that big data software will grow its market from $18.3 billion in 2014 to more than $92.2 billion in 2026. By reaching out to developers at the ground level, Qlik and its Playground give the company a hook to become part of the systems being built by both small and enterprise businesses alike.
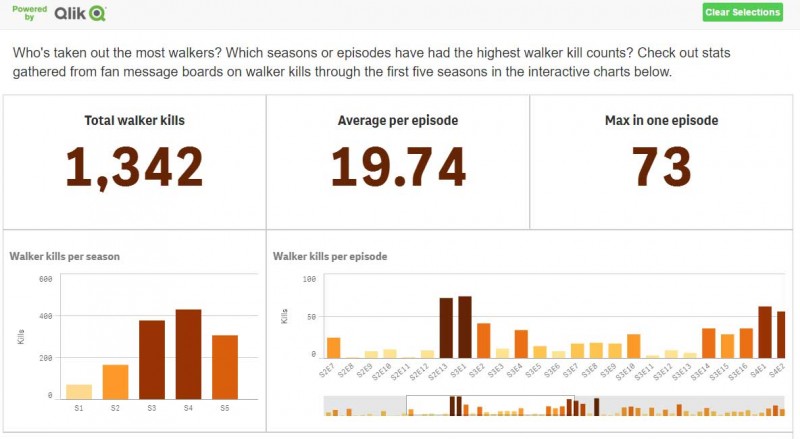
Qlik can even be used to visualize events from a TV series, such as this example from AMC’s The Walking Dead. Screenshot courtesy of Qlik
In order to give prospective developers a reason to jump into the platform and get a taste of what the Qlik analysis engine can do, Qlik provides a showcase of real-life visualizations.
With Qlik’s engine, developers produced a simple visualization of how much beer different countries in the world drink per-capita with various different charts. (Apparently the United States is second only to China when it comes to total liters of beer consumed.) Fans of AMC’s “The Walking Dead“ TV show can also get their own data visualization of how many zombies have been killed throughout the series with visualizations of how many killed per season, average per episode and even zombies slain per individual person. For a more practical visualization, Qlik Playground also powers a map-based visual of AirBnB locations in certain cities with local weather and a search filter (the result of a Qlik hackathon).
While some of the above examples are whimsical, they also show the breadth of capability of the analysis engine on conceptually different datasets. The datasets for some of these examples are also available for developers who have signed into the Qlik Playground application. There, developers can tweak the coding that produces the example graphs to create new visualizations, giving a hands-on experience with the data.
The Qlik Playground gives developers an opportunity to try out the Qlik analytics engine and the visualization components before making a decision to implement it in their own applications or go up the management chain to get it approved for use.
More details are available on the Qlik Playground website as well as a free sign up for developers to play on the equipment and in the sandbox.
Support our mission to keep content open and free by engaging with theCUBE community. Join theCUBE’s Alumni Trust Network, where technology leaders connect, share intelligence and create opportunities.
Founded by tech visionaries John Furrier and Dave Vellante, SiliconANGLE Media has built a dynamic ecosystem of industry-leading digital media brands that reach 15+ million elite tech professionals. Our new proprietary theCUBE AI Video Cloud is breaking ground in audience interaction, leveraging theCUBEai.com neural network to help technology companies make data-driven decisions and stay at the forefront of industry conversations.