


 BIG DATA
BIG DATA
BIG DATA
BIG DATA
Modern data visualization tools such as Tableau and QlikView make it possible to create all kinds of sophisticated business graphs, but certain information is simply too complex to fit on a regular two-dimensional dashboard.
In an effort to fill the gap, Google Inc.’s research unit on Wednesday announced that it has open-sourced a data navigation system dubbed Embedding Projector that provides the ability to create “high dimensional” views. The tool derives its name from a class of mathematical structures known as embeddings that are used by machine learning algorithms to represent the different aspects of the information they process. An artificial intelligence tasked with analyzing natural-language text, for instance, would employ such a construct to store the semantic relationships among words.
The problem is that embeddings aren’t nearly as intuitive to read for humans. In fact, interpreting them manually is often outright impossible when large amounts of data are involved, which is where Embedding Projector comes into play. The tool can visualize information from machine learning applications in a way that allows analytics professionals to easily identify areas for improvement.
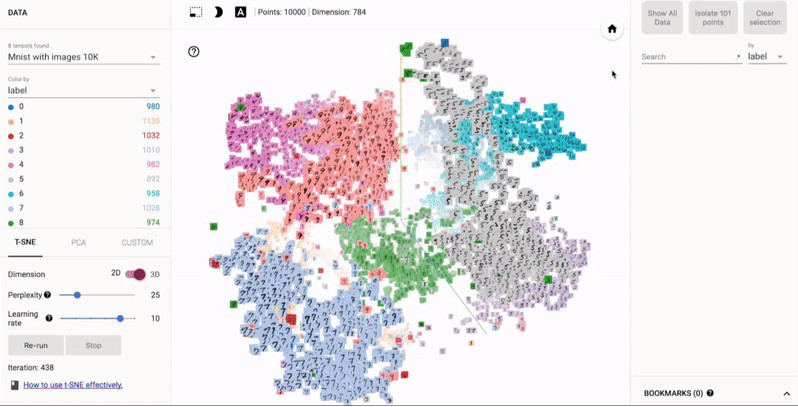
To demonstrate its capabilities, Google used Embedding Projector on an internally developed machine learning model tasked with finding synonyms for the word “important.” The algorithm was created with the search giant’s own TensorFlow artificial intelligence engine and word2vec text processing guide. In its visualized form (seen here), words such as “significant” and “vital” are placed at varying distances from the word “important” to illustrate how closely they’re related.
And that’s just the tip of the iceberg. According to Google, Embedding Projector can also produce three-dimensional data models not unlike those used to simulate physical objects that let analysts examine their information from different angles.
Users will be able to organize their data in one of three ways. The first involves a method called principal component analysis for uncovering the internal structure of embeddings. Another is a technique dubbed t-SNE that focuses more on visualizing specific data points. Lastly, analytics teams can apply their own custom modeling approaches if they wish to focus on a different component of a given algorithm.
Google designed Embedding Projector mainly with machine learning algorithms in mind, but its capabilities can come potentially come handy for other types of data processing projects, too. As a result, the search giant has decided to release two separate versions of the tool: An embedded edition integrated with TensorFlow and a standalone web-based implementation that doesn’t require any downloads.
Support our mission to keep content open and free by engaging with theCUBE community. Join theCUBE’s Alumni Trust Network, where technology leaders connect, share intelligence and create opportunities.
Founded by tech visionaries John Furrier and Dave Vellante, SiliconANGLE Media has built a dynamic ecosystem of industry-leading digital media brands that reach 15+ million elite tech professionals. Our new proprietary theCUBE AI Video Cloud is breaking ground in audience interaction, leveraging theCUBEai.com neural network to help technology companies make data-driven decisions and stay at the forefront of industry conversations.


