


 APPS
APPS
APPS
APPS
APPS
Google LLC is building on the machine learning technology that was integrated into its spreadsheet software last year.
The company said today that it’s enhancing the “Explore” feature in Sheets with new capabilities including formula suggestions and pivot tables powered by machine learning that are designed to deliver faster and more useful insights. Sheets is part of Google’s productivity suite, meant to rival Microsoft Corp.’s popular Excel spreadsheet software.
For most users, the most noticeable update will be to the formulas function that’s commonly used to quickly analyze the data in spreadsheets. Users typically type quick formulas such as =SUM or =AVERAGE into sheets in order to get answers from their data, such as the sum of all the amounts written in a specific column or row.
Google reckons this functionality is getting a bit antiquated, though, because it takes time to ensure that these formulas are written correctly. To speed things up, Google has added a dash of machine intelligence to the process, so that when users begin typing a formula, Sheets will pop up a few suggestions for full formulas based on the context of the data in the specific spreadsheet.
“We designed this to help teams save time and get answers more intuitively,” explained Beri Lee, product manager at Google Sheets.
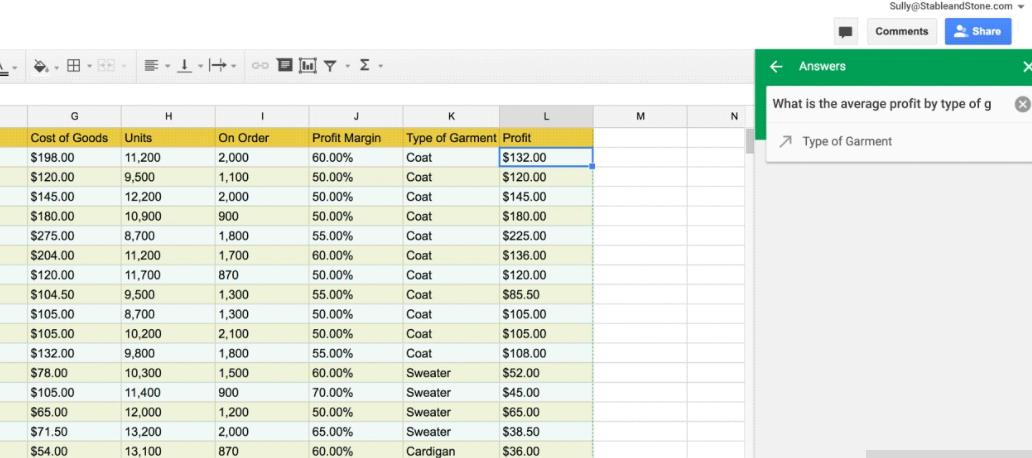
The second update has to do with something called Pivot Tables, which are used to summarize large data sets and find patterns within that data. The problem is that creating pivot tables is a bit tricky and time-consuming, so Google is lending a helping hand. Now, Sheets can intelligently suggest pivot tables to find the answers users need.
The great thing about this new feature, according to Google, is that users can ask questions of their data using everyday language. For example, they can type “what is the sum of revenue by salesperson?” and Sheets will suggest the best pivot table to find the answer to that question. Again, these suggestions are powered by machine learning.
Additional new features in Sheets include a new user interface for pivot tables, along with customizable headings for rows and columns, and also some new ways to view data.
“Now, when you create a pivot table, you can “show values as a % of totals” to see summarized values as a fraction of grand totals,” Lee explained. “Once you have a table, you can right-click on a cell to “view details” or even combine pivot table groups to aggregate data the way you need it.”
Google also added the ability to create something called “waterfall charts,” which provide a way to visualize sequential changes in data. Finally, the company added the ability quickly and easily to import or paste “fixed-width formatted data files” to Sheets.
Google said the new updates will be rolled out in coming weeks.
Support our mission to keep content open and free by engaging with theCUBE community. Join theCUBE’s Alumni Trust Network, where technology leaders connect, share intelligence and create opportunities.
Founded by tech visionaries John Furrier and Dave Vellante, SiliconANGLE Media has built a dynamic ecosystem of industry-leading digital media brands that reach 15+ million elite tech professionals. Our new proprietary theCUBE AI Video Cloud is breaking ground in audience interaction, leveraging theCUBEai.com neural network to help technology companies make data-driven decisions and stay at the forefront of industry conversations.