


 NEWS
NEWS
NEWS
NEWS
NEWS
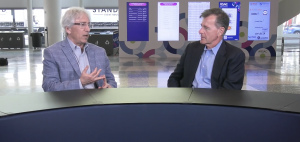
 From the 2013 Tableau Customer Conference in Washington DC, theCUBE co-hosts Jeff Kelly, Principal Research Contributor with Wikibon, and Dave Vellante, Wikibon Senior Analyst, sat down with Jon Schwabish, Principal Analyst with the Congressional Budget Office, talking about projections and trends in the field of economics.
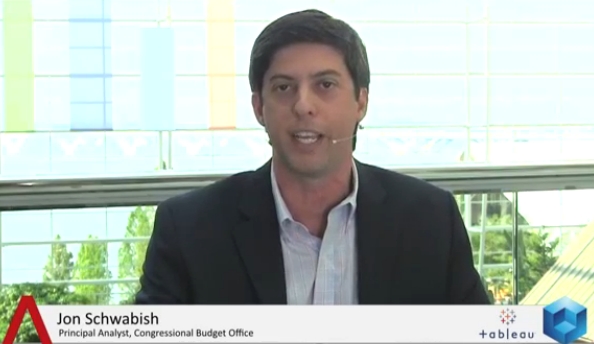
For those unfamiliar with the institution, Jon Schwabish was happy to clarify: “The CBO is a relatively small agency in the Federal Government, about 230 people. We provide objective, non-partisan analysis to Congress. Those issues can range from immigration to social security, Budget issues, long term budget issues, anything that the Congress would be interested in working on.”
It was at this time the topic from an earlier segment came up, as guest and famed statistician Nate Silver was talking about the bias in the data. Vellante wanted to know “how does one remain objective.” Schwabish replied:
“We have a lot analysts and we’ve been working a long time on various issues and we construct the most objective and unbiased models that we can. We have a lot of outside people who review our work as well as internal people that go through line-by-line, code-by-code, looking at all the results, making sure we’re providing a non-biased approach to the issue that we have to talk about.”
As for long term modeling, Jon Schwabish declared having a varied portfolio: a social security and micro-simulation model. “We simulate a population going forward into time, simulating people claiming benefits, finding out what sort of benefits they get, what’s their behavior over their lifetime, how do they work, when do they get married and when do they have kids. I also work on issues such as food stamps and immigration. Over the last couple of years I’ve been moving into the field of data visualization and presentation techniques.”
As Schwabish is an economist by trade, Vellante asked him what’s changed, in his opinion, over the last 10 years, in terms of how data is being used.
“One of the things you see in the economics profession is that people are not quite at the point where they know how to communicate their results. So, in this profession, a static graphic is created and a report is embedded and surrounded with a bunch of text. All the developments of the last 3 to 5 years (data visualization, data management, open source software languages) is enabling us to communicate in different ways. But I don’t see the traditional academics using these various tools. At CBO we’re trying to use those tools to create more effective and compelling infographics to communicate our work to the Congress in different ways.”
As Dave Vellante noted, the profession has acquired a bad reputation due to unfortunate forecastings. Schwabish agreed, saying “Projections are very hard to do. Most of my work is in the long term, so you can imagine that a projection 10 years into the future is difficult enough, but 75 years into the future is even more difficult, but it’s important to do for a program like social security and MediCare, where this inter-generation transfer of wealth is going on.
“What we’ve been doing, and where data visualization has been helping both on the analytics and the presentation side, is using a variety of tools out there that are helping us sift through the data and understand the correlations and relationships between different variables. Tools like Stata, SaaS and Tableau are helping us understand data in different ways.”
Jeff Kelly brought the subject of causation vs. correlation into the mix, asking Schwabish his opinion on the matter, from an economist’s perspective.
“When we think about the relation between food stamps and the economy and the employment rate, we see a correlation, but then again we see how a policy might affect other policies, so that’s a sort of a causation. [There] is a certain tension there,” admits Schwabish.
Because Schwabish said at the start of the interview that the economists are not communicating very efficiently, Jeff Kelly had him elaborate on that.
“What economists tend to do is do their analytics – they may be using data visualization tools in those analytics, maybe using Stata, SaaS, SPSS, MathLab or Tableau to create graphs, and visualizations help them understand their work and their data, but then they take that graph and put it in a report, without thinking how to communicate the results more effectively to their audience,” Schwabish explained.
What is your modeling showing you? asked Vellante. “Our challenges mean telling the Congressmen about the economy in ways that they can communicate to their constituents and to their colleagues and to their staff,” said Schwabish. “We tried to take the message that we’ve been talking about and communicate it in different ways. We’ve been moving from the standard PDF reports to creating static infographics and smaller cards, we’re getting more into the social media – CBO just launched its Twitter feed.”
Schwabish also believes that, in time, more and more economists will be blogging actively, using data visualization to communicate in ways that haven’t been done before.
Support our mission to keep content open and free by engaging with theCUBE community. Join theCUBE’s Alumni Trust Network, where technology leaders connect, share intelligence and create opportunities.
Founded by tech visionaries John Furrier and Dave Vellante, SiliconANGLE Media has built a dynamic ecosystem of industry-leading digital media brands that reach 15+ million elite tech professionals. Our new proprietary theCUBE AI Video Cloud is breaking ground in audience interaction, leveraging theCUBEai.com neural network to help technology companies make data-driven decisions and stay at the forefront of industry conversations.