

 NEWS
NEWS
NEWS
NEWS
NEWS
Stats and sports have a long history together, and modern analytics technology has only fanned the flames of love. Big Data can provide the insight on one’s own team and rivals alike, which begs the question: is number-crunching the real sport?

Before sensor-riddled helmets could measure concussion risk or wired practice gear could assess the risk of dehydration, individuals relied on their eyes, a notepad and pencil, including Charles Reep, an RAF officer and accountant, who pioneered the use of data in sports in the 1950s.
Reep watched football games and took note of players’ moves. It took him three months to go through all the data he gathered in the 1958 World Cup Final. His patented notational analysis has changed how teams play and how fans enjoy the games.
Today analysts have oceans more data to work with, coming in from an ever-increasing number of sensors hitting sports fields. To work through it all, analysts are armed with the most powerful computers known to man. Those factoids sometimes trickle down to we mortals, packaged nicely below.
300 sensors: The number of sensors on board the Oracle Team USA’s yacht that greatly contributed to the team’s great comeback during America’s Cup in 2013. The sensors allowed the team to analyze data collected in real time and make decisions faster.
Asim Khan, Director of Information Systems for Oracle Team USA, explained that 300 sensors and 3,000 variables allowed them to measure strain on the mast, pressure on the hull, wind velocity and other factors in real-time that affected the speed of the yacht. The data collected was transmitted to the Oracle Database on the performance chase boat which allowed them to focus on certain areas when necessary such as measuring sail wing performance in certain conditions. The feed is focused heavily on the data from the wing allowing them to make faster decisions on what maneuver needs to be performed.
100MB: Average amount of data used by fans attending games at the Levi’s Stadium. About 21,000 to 23,000 fans use the stadium’s Wi-Fi each game, and the peak bandwidth usage ranges from 1.5GB/s to 3.1GB/s.
100MB is approximately the equivalent of taking 12 photos using a 12.2MP camera set in the highest resolution, or about 20-50 songs depending on how long the songs are. With an average of 68,500 fans each game, delivering 100MB of Wi-Fi data to each fan has been quite a challenge for Levi Stadium.
After poor Wi-Fi led to incomplete orders made with the stadium’s food and beverage app, Levi’s IT team has added additional frequency control protocols to manage the obstacles in scaling a network.
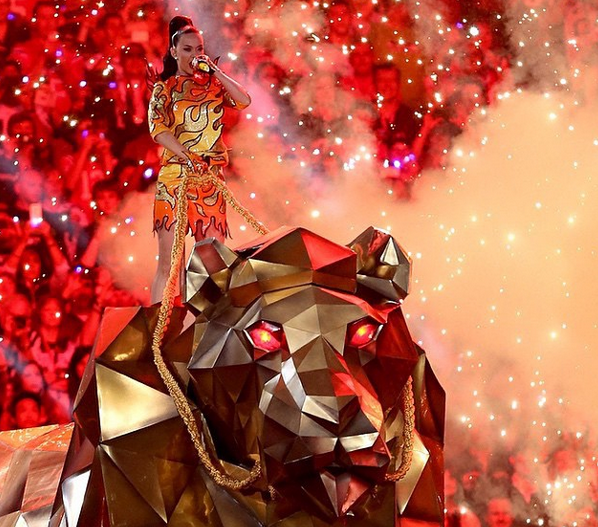
3: According to the Twittersphere there are three key moments in the recent Super Bowl XLIX: When Malcolm Butler of the New England Patriots intercepted a pass by Russell Wilson of the Seattle Seahawks 20 seconds before the game ended which generated 395,000 tweets per minute; when the New England Patriots officially won Super Bowl XLIX which generated 379,000 tweets per minute; and after Katy Perry’s halftime performance which generated 284,000 tweets. It was regarded as the ‘most tweeted Super Bowl ever.’
.
17,000: The approximate number of shared location-tagged posts in and around the University of Phoenix Stadium during Super Bowl XLIX. The majority of these posts were Instagram uploads, such as the one featured above.
photo credit: X-Ray via photopin (license) and azsuperbowl
Support our mission to keep content open and free by engaging with theCUBE community. Join theCUBE’s Alumni Trust Network, where technology leaders connect, share intelligence and create opportunities.
Founded by tech visionaries John Furrier and Dave Vellante, SiliconANGLE Media has built a dynamic ecosystem of industry-leading digital media brands that reach 15+ million elite tech professionals. Our new proprietary theCUBE AI Video Cloud is breaking ground in audience interaction, leveraging theCUBEai.com neural network to help technology companies make data-driven decisions and stay at the forefront of industry conversations.