


 BIG DATA
BIG DATA
BIG DATA
BIG DATA
This is a sponsored post commissioned by Hitachi Vantara Corp. Sponsored posts are paid content that appear on all pages of SiliconANGLE.com, supporting editorial efforts. For pricing and inquiries, email sponsor@siliconangle.com.
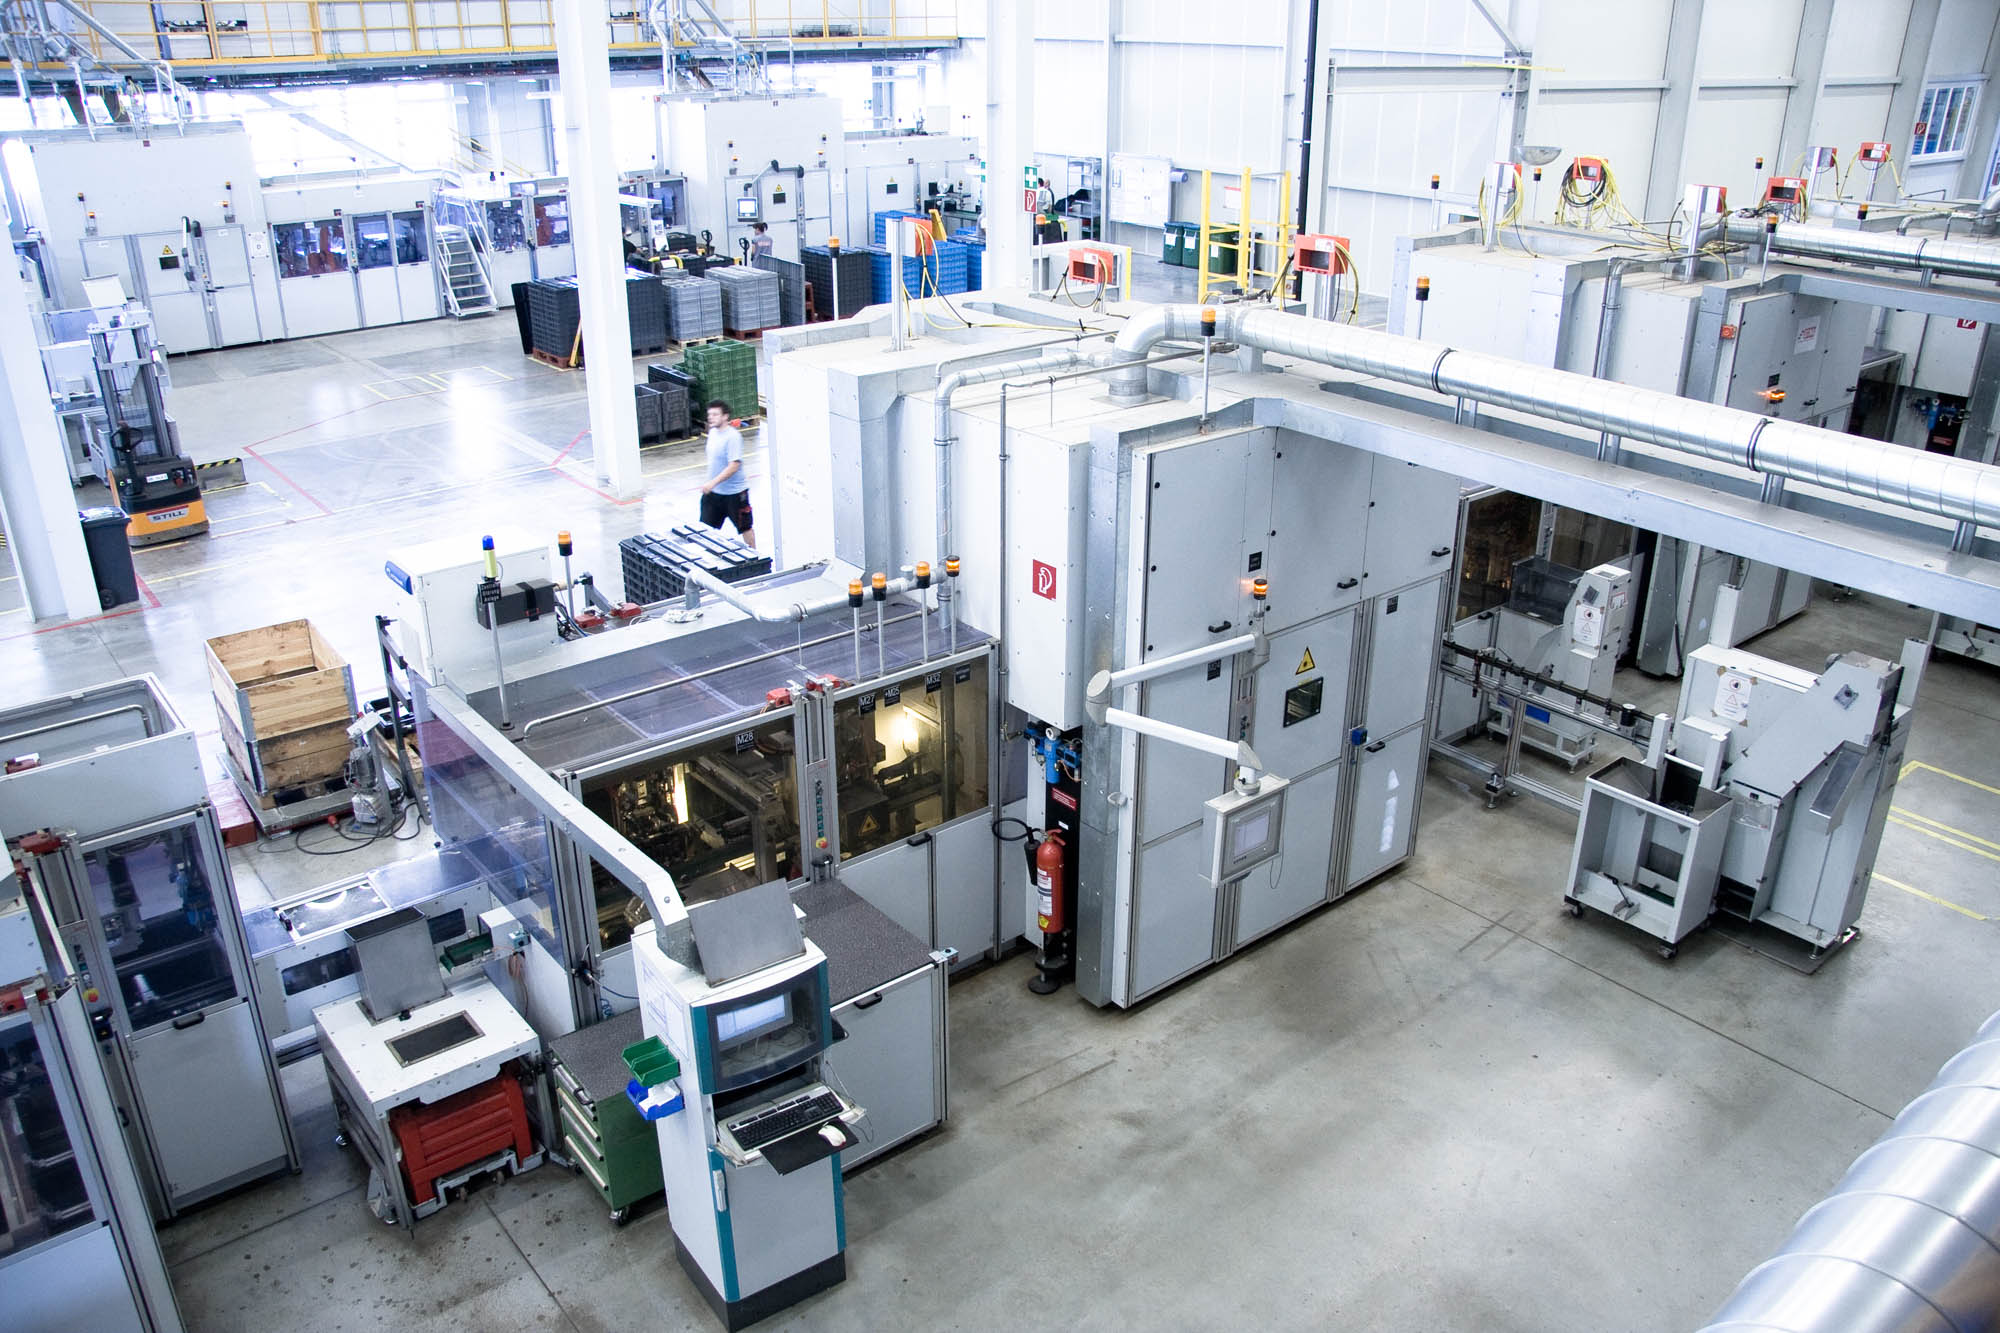
Today’s manufacturing plants are finely tuned machines in themselves. Production is choreographed with split-second accuracy, which means downtime on one machine can bring a whole assembly line to its knees.
That’s where the STIWA Group and its Manufacturing Software business unit bring unique value to their customers. A global leader in product and high-performance manufacturing automation with more than 1,600 employees, STIWA is the maker of automation machinery and software for manufacturing companies, and it distinguishes itself from its competition through the sophisticated analytics it applies to keep equipment running at peak performance. Customers see STIWA as not just an equipment provider, but also a strategic consultant in process efficiency.
“Our machines are highly automated with low needs for human operators,” said Maik Hering, a STIWA product management software expert based in Hagenberg, Austria. “We provide data about all of these machines and build the software to analyze it. We’ve been doing ‘internet of things’ for over 20 years.”
That kind of added value is critical in a manufacturing equipment market that is subject to constant pressure from low-cost competitors. Companies like STIWA are using data to help them compete on factors other than price by showing customers how they can improve operational efficiency, product quality and volume of output.
STIWA’s machines bristle with sensors that constantly monitor and report on a wide variety of operating conditions. “Each machine produces hundreds of measurements per hour,” Hering said. The data from all of these sensors quickly adds up. For example, one customer runs more than 200 machines that produce 6 million parts annually. Each part generates 6.6 megabytes of data for a total of nearly 40 terabytes of machine-generated data.
“The data is so complex that no one can understand it without visualization,” Hering said. Until recently, those visualizations were limited and reports burdensome to produce. The analytics software STIWA had been using for 15 years was showing its age.
For one thing, the legacy-tools could only produce a limited set of predefined reports about one machine at a time. This put customers at a disadvantage in trying to diagnose problems in increasingly interconnected manufacturing environments. The software could also only analyze machine data and not the product quality data that is increasingly important for outcome-focused manufacturers.
Customers couldn’t track data on the same parts produced by several machines, which was a big problem for larger customers. For example, STIWA’s large base of automotive customers “have to document the way a part is manufactured going back 15 years,” Hering said. “We couldn’t support that kind of reporting, so it was up to the customers to think of their own ways to do it.” That often meant searching through text files under tight regulatory deadlines.
Custom reports were another problem. Each customer has its own key performance indicators, and not all were addressed by the standard reports STIWA shipped with its equipment. That meant customers needed to request customized reports individually, causing STIWA software developers to put aside more strategic projects to deal with one-off requests.
The problem wasn’t the data – STIWA was collecting plenty of that – but the tools needed to make sense of it. The limitations of legacy analytics tools were holding back their aggressive plans to expand globally with multinational customers, who are turning to data to help them compete beyond price to increase operational efficiency, product quality, and production output.
“We needed to analyze data across multiple machines within a whole factory to get KPIs and eventually evolve to support factories across the world,” Hering said. STIWA turned to Hitachi Vantara’s Pentaho data integration and analytics platform to replace its aging analytics software.
STIWA struck an OEM relationship with Hitachi Vantara to embed Pentaho AMS Analysis-CI, STIWA’s analytics product that combines its industrial production expertise with out-of-the-box reporting and a predefined analytics path. STIWA has built out a selection of special chart types and data ingestion filters to integrate data from its equipment, and AMS Analysis-CI can also be adapted to the specific needs of the customer.
A key benefit of the Pentaho-driven product is its support for customer self-service. Nontechnical users can use visual dashboards to build their own reports out of drag-and-drop tools and pre-defined objects. That means STIWA developers can focus on mission-critical product work instead of one-off reports.
“Previously, creating a report meant one week of development and testing for the software engineering team,” Hering said. “With AMS Analysis-CI and Pentaho, new reports and dashboards can be created by end users in a few minutes.”
Pentaho’s data integration capabilities address a critical shortcoming of the previous solution. AMS Analysis-CI customers can pull data from multiple machines, and even from other manufacturing facilities. “They can see data from all over their factory in one view,” Hering said. “They can now answer their own questions. They couldn’t do that before.” That capability is crucial to helping STIWA penetrate global manufacturing markets.
Based upon early customer experiences, the new integration suite is a hit. Customers report a 30 percent reduction in the time needed to bring new machines online. They also have access to more timely and relevant operating information that helps avoid expensive downtime. That’s contributed to an average 15 percent improvement in production line productivity. “These machines have to work as fast and as long as possible,” Hering said.
STIWA’s costs for IT interfaces have fallen by 35 percent, in large part because developers are no longer required to create reports. They can now be set up in minutes by individual end-users.
Self-service reporting means customers can also establish their own KPIs, including product quality data. For many customers, the most important KPI is overall equipment efficiency, or OEE, a measure of how quickly a machine is working, how much downtime it’s experienced and how efficiently overall production is proceeding.
Pentaho can also ingest data from multiple pieces of equipment simultaneously into visual reports that identify slowdowns and hot spots, a key tool for problem identification. Previously, customers had to sort through operating reports for each different machine to determine, for example, which one was slowing down the assembly line. “They might have seen that something might be wrong, but they didn’t know which screw to turn,” Hering said. AMS Analysis-CI gives them one dashboard with multiple views, “so they can see in seconds where there are problems,” he said. “Before, everyone would stand at the machine trying to figure it out.”
Customers can also create their own views of data according to their needs. That’s important because factory equipment has multiple stakeholders like logistics professionals, management and engineers. “Everyone has their own view, but we can also combine them into one view,” Hering said. Data can be exchanged with customers’ total quality management, enterprise resource planning, manufacturing execution and product lifecycle management software.
Pentaho’s adaptable integration engine is well-suited to the unique characteristics of each market, as well as the changing needs of manufacturing customers. For example, the engine can seamlessly normalize temperature data in Fahrenheit or Celsius, or measurements in feet or meters to produce reports that are consistent across geographies. It’s also designed to handle unstructured data like WAV files, which can provide important audible warnings of equipment malfunctions.
Pentaho gives customers the ability to manage unstructured data as if it was in a database. That’s important to automotive product makers, who formerly had to search through text files to gather data. They can now click on a part and get all the information they need about when and where each part was produced, and even on which machine.
Advanced analytics has created a new revenue stream by giving STIWA the means to charge for customized analytics that span multiple types of machinery. “Everyone is excited about the possibilities. Our customers have said these new features are cool,” Hering said.
More importantly, the features give them a competitive edge. Having up-to-date, integrated data about the entire factory floor cuts costs and better enables STIWA’s customers, many of whom are based in Europe, to go head-to-head with low-cost factories in developing countries.
That goes to show that even in an industry that continually seeks the lowest costs of labor, data can make a big difference.
Support our mission to keep content open and free by engaging with theCUBE community. Join theCUBE’s Alumni Trust Network, where technology leaders connect, share intelligence and create opportunities.
Founded by tech visionaries John Furrier and Dave Vellante, SiliconANGLE Media has built a dynamic ecosystem of industry-leading digital media brands that reach 15+ million elite tech professionals. Our new proprietary theCUBE AI Video Cloud is breaking ground in audience interaction, leveraging theCUBEai.com neural network to help technology companies make data-driven decisions and stay at the forefront of industry conversations.