


 CLOUD
CLOUD
CLOUD
CLOUD
CLOUD
Analysis from company earnings reports and customer surveys continues to show that Microsoft Azure and Google Cloud Platform are closing the gap on Amazon Web Services’ cloud dominance.
Although reporting definitions of cloud remain fuzzy, it’s clear that the Big three U.S. cloud players are leading the steady march into the stronghold of on-premises workloads. The global coronavirus pandemic has only strengthened the cloud’s position in the marketplace, according to our data.
As we reported last week, the story of the haves and have-nots is playing out in several sectors and in this analysis, we take closer look at the largest cloud players. We will specifically do a deeper investigation of AWS spending momentum within its growing portfolio of services.
In this week’s Wikibon CUBE Insights, powered by Enterprise Technology Research, we will try to accomplish three things:
The first data point we want to share with you tells a familiar story and drafts off of the theme we’ve set for the past several weeks: the bifurcation in the market.
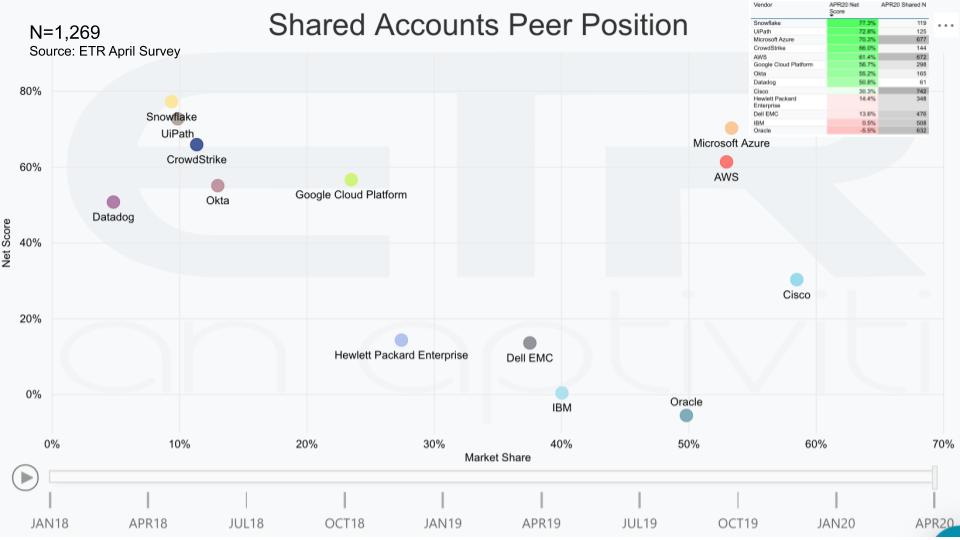
This chart is ETR’s version of a magic quadrant, but it uses survey data to plot the vendors. On the y axis is the metric of Net Score, which is a measure of spending momentum. To review, each quarter ETR surveys more than 1,200 chief information officers and information technology pros and asks them,, “Are you spending more or less on a particular supplier?” We subtract the less from the more and the remainder is the Net Score, sort of like a Net Promoter Score.
The x axis is called market share. It’s not market share like IDC measures share; rather, it’s a measure of pervasiveness in the survey. It’s calculated by dividing the mentions of a particular company by the total mentions in the survey or segment.
Several points are notable here:
We’ve plotted a number of other enterprise players including many on-premises leaders such as Dell Technologies Inc., IBM Corp., Oracle Corp. and Cisco Systems Inc. We’ve also included some of the companies that are showing real promise from a momentum, penetration and business model standpoint. These companies include Snowflake Inc., the analytics database disruptor; UiPath Inc., the specialist in robotic process automation; Okta Inc. and CrowdStrike Holdings Inc., which are thriving in security; and Datadog Inc., the cloud monitoring service.
We’ve superimposed in the upper right a table showing the net scores and Shared N data for each of the companies – meaning the number of mentions in the data cut for each company. Based on the Net Scores, and the Shared Ns, the story quantifies that cloud has both momentum and is penetrating the enterprise market. We believe this will continue to grow at a rate 10 times faster than the traditional enterprise space.
As we’ve reported many times, downturns have historically been good for cloud computing. But the on-prem leaders, as you can see by Cisco’s position for example, are still positioned to compete with their large installed bases and resources. We will be covering winning strategies for legacy players in a later segment, but for now we’ll just stress that if you’re a customer with lots of on-prem infrastructure and you’re building data centers, unless you’re a big cloud provider you’re probably going to be on the wrong side of history.
Let’s take a look at the Big Three and update their infrastructure-as-a-service and platform-as-a-service numbers. All three recently reported earnings and the chart below shows the data for each:
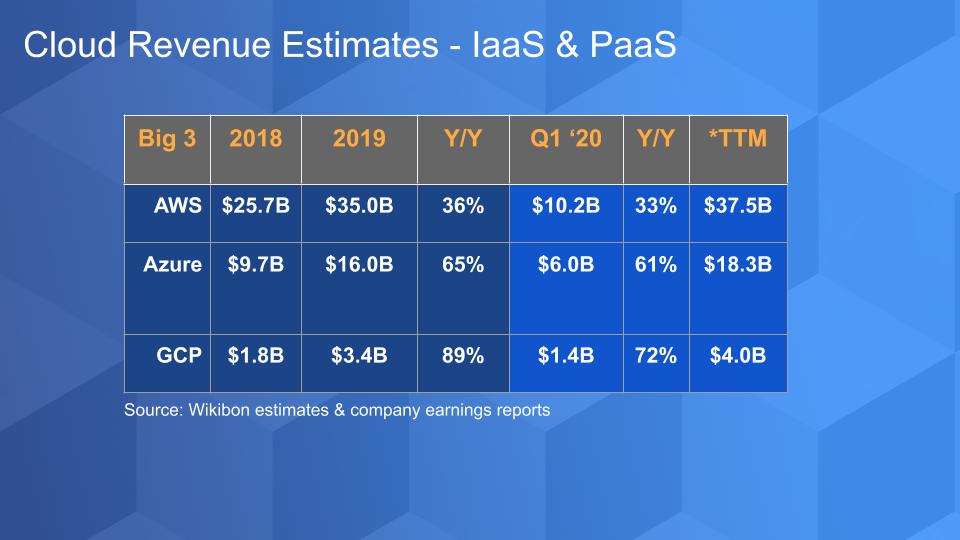
As you can see, all three have substantial businesses, with AWS by far the largest and GCP growing the fastest. What’s notable is that AWS in 2018 was 2.7 times larger than Azure and today that delta is under two times based on our first-quarter estimates and just about two times on a trailing 12-month basis.
We caution that AWS numbers are the cleanest. Amazon religiously reports an easy-to-understand revenue and operating profit number each quarter for AWS. Microsoft and Google are much more fuzzy. For example, in reading through the Microsoft 10k reports, you’ll see that its Intelligent Cloud revenue comprises public and private clouds, hybrid, SQL Server, Windows Server, Systems Center, GitHub, Enterprise support and consulting services, and — oh yes — Azure.
So we have to estimate how much of that hairball is actually pure IaaS and PaaS in the public cloud.
Google similarly just started breaking out its cloud revenue and bundles more than just IaaS and PaaS in its numbers.
Having stated that, both Microsoft and Google do give tidbits of guidance in the form of growth rates or commentary on growth rates for their respective IaaS and PaaS businesses (that is, Azure and GCP). As such, this is our best estimate given all that is reported and what we know from survey data.
We also want to point out that these clouds differ in quality and fit for specific use cases. For example, Microsoft is building a cloud to support its huge installed base of customers and make it convenient for them to tap its cloud services. But it may not be the most robust cloud. As has been widely analyzed in the press, Microsoft is struggling to provide adequate capacity for its customers. It’s using the COVID-19 pandemic as a bit of a heat shield on this issue.
Microsoft issued a blog post essentially saying that it will prioritize first responders, health workers and essential businesses during the COVID pandemic, plus Teams customers. So OK – that’s one of those caveat emptor situations if you’re not in one of those camps, or maybe even if you are.
But clearly Microsoft has momentum across its vast portfolio, including cloud, and that’s what we want to get to in this next data point:
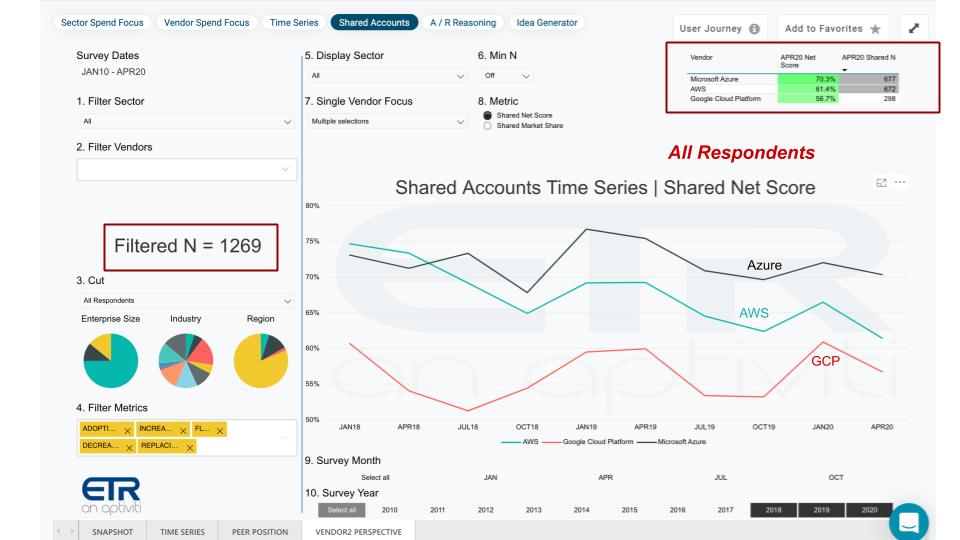
As we’ve been reporting for quite some time based on the ETR survey data, the big cloud players have very good momentum as measured by Net Scores. The chart above shows the most recent survey results of 1,269 IT buyers. And you can see broadly that all of the Big Three are well in the green for Net Scores as shown in the upper right hand box. Well over 50% Net Scores for all three and Microsoft Azure in the 70% range, indicating very strong demand across the board.
Remember, ETR is asking buyers to comment on the areas with which they are familiar. So a buyer might be interpreting “cloud” to include things in Microsoft and Google that may not be in the AWS responses (such as Azure Stack or G Suite). But it doesn’t matter; the point is they all have momentum and you can see, even though there’s a dip in the most recent survey – which ran during the peak of the shutdown in the U.S. — relative to other parts of the survey, cloud is very strong, with Net Scores well above 50%.
What’s more, the data doesn’t lie. Recent customer data shows that Microsoft’s customers are reporting greater sustained spending velocity for Azure relative to AWS and GCP.
Digging into the data a bit more, let’s take a look at the Net Score data in the Fortune 500:
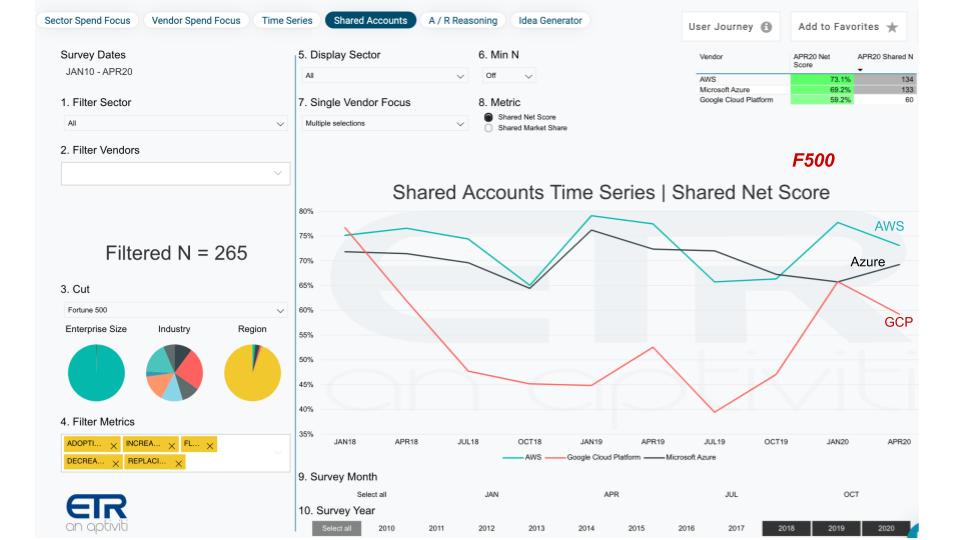
Of course, this is an indicator of spending within larger companies and you can see AWS overtakes Azure by a small margin — noting the same caveats we mentioned earlier. But the strength of Net Scores for all three is meaningful as they all increase within these larger buying bases at 60% to 70% or even above.
If we extend that cut to include the Fortune 1000, you can see in the chart below that all three companies continue to show strength:
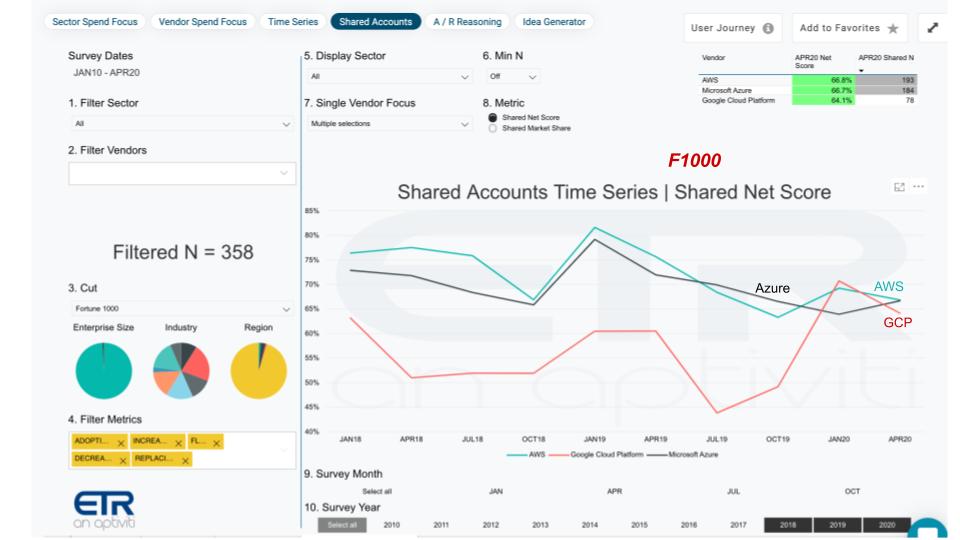
Notice that there’s a convergence, which says to us that a multicloud picture has emerged. CIOs are now starting to see that whether through M&A or shadow IT or whatever, they’re faced with a variety of choices that are viable. And despite our sometimes snarky comments that multicloud has been more of a symptom of multivendor than a clear strategy, that perhaps is beginning to change as IT is being asked to bring coherence, governance and best practices across clouds.
We want to close by taking a closer look at AWS’ business specifically. And we want to come back to that notion of Net Score.
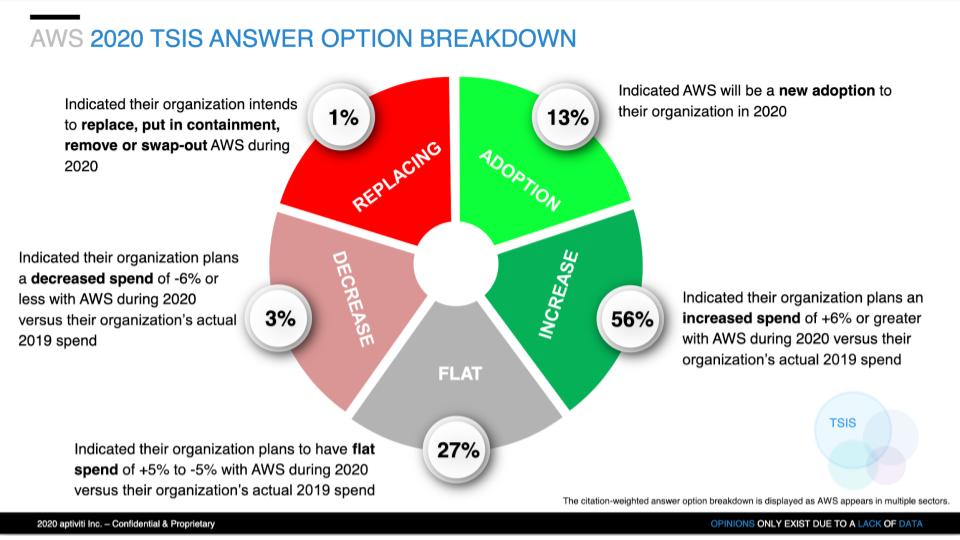
The chart above shows the breakdown of responses across more than 600 AWS customers in the April ETR survey. Remember, this survey ran at the height of the lockdown in the US. It is a global survey with well over 100 AWS responses outside the U.S. But what’s relevant here is the strength of the AWS business.
This chart shows how Net Score is derived. ETR asks customers, “Are you: 1) Adopting new; 2) Increasing spend – meaning 6% or more; 3) Spending flat (+/- 5%); 4) Decreasing spend by more than 6%; or 5) Leaving the platform or replacing?” Subtracting the reds from the greens yields Net Score.
The bottom line is nearly 70% of customers plan to spend more in 2020 on AWS than they spent last year; and only 4% of AWS customers in the sample plan to spend less.
That is pretty impressive for a player with a $38 billion business.
The next data point we want to share shows where the action is across the AWS portfolio:
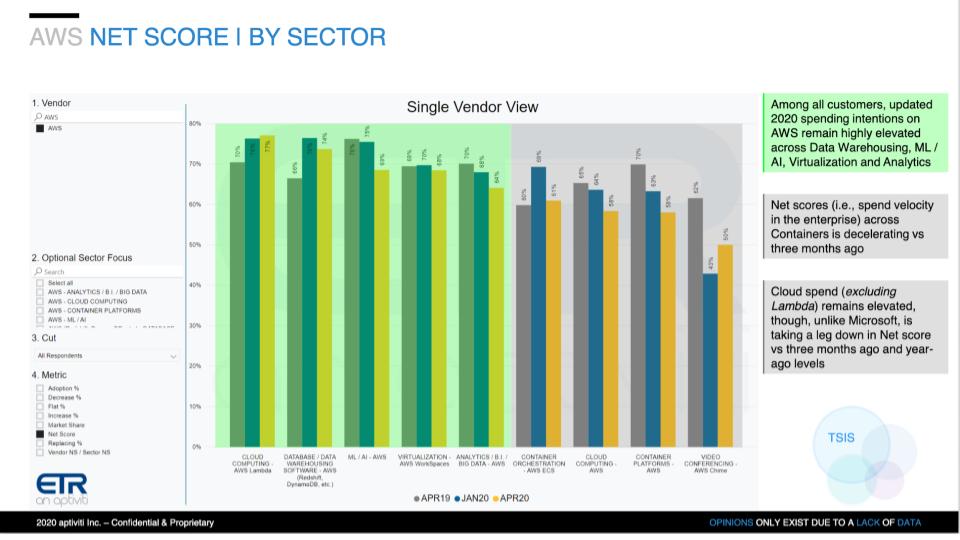
The chart above shows Net Score or spending momentum calculations based on responses from an N of more than 700 customers using AWS services. The bars compare the results of three surveys – last April, January 2020 and April 2020. As you can see, AWS is seeing highly elevated spending velocity across most if not all of its key business lines. This includes cloud functions, data stores, AI/ML and WorkSpaces with the work-from-home pivot.
In the gray zone, there are some areas that are less robust but nothing in the red zone. Red zone for Net Scores would roughly range below 25% and as you can see, there’s nothing close to that in the AWS portfolio.
There is some concern in the data that the core AWS cloud computing category (third set of bars from the right) are down whereas the survey data (not shown above) indicate that Microsoft Azure is not facing a similar deceleration (that is, Microsoft Azure’s Net Scores are roughly flat from the January survey).
But the bottom line on AWS is a large base and still very strong growth.
As we’ve stated many times, historically downturns have helped cloud computing. We saw this in 2008 when chief financial officers pivoted from capital expenditures to operating expenditures, and we’re seeing today that cloud is gaining even more traction. The idea of being able to experiment cheaply, dial up and dial down resources, and add capacity in an environment of social distancing is appealing and has momentum. Building out data centers is just not a good use of capital unless you’re in the business of selling that capacity at massive scale.
Watch for more software companies testing “true cloud” pricing models where they’re not forcing you to lock in for one-, two- or three-year terms. Rather they’ll let their products and customer intimacy and value create stickiness. They will use analytics to predict churn rates and they’ll allow customer loyalty to help them predict future revenue streams.
We’ll end on multicloud. It appears to be gaining momentum if for no other reason than it gives customers choice. While an all-homogenous environment would probably lower costs by 15%+ and create a more secure environment, mandating a one-size-fits-all cloud is just not practical.
Next week we’ll have more sector drilldowns. Remember these episodes are all available as podcasts wherever you listen. Ways to get in touch: Email david.vellante@siliconangle.com, DM @dvellante on Twitter and comment on our LinkedIn posts. Also, check out this ETR Tutorial we created, which explains the spending methodology in more detail.
Here’s this week’s full video analysis:
Support our mission to keep content open and free by engaging with theCUBE community. Join theCUBE’s Alumni Trust Network, where technology leaders connect, share intelligence and create opportunities.
Founded by tech visionaries John Furrier and Dave Vellante, SiliconANGLE Media has built a dynamic ecosystem of industry-leading digital media brands that reach 15+ million elite tech professionals. Our new proprietary theCUBE AI Video Cloud is breaking ground in audience interaction, leveraging theCUBEai.com neural network to help technology companies make data-driven decisions and stay at the forefront of industry conversations.