 CLOUD
CLOUD
 CLOUD
CLOUD
 CLOUD
CLOUD
Atlassian, maker of the project automation software Jira, today announced four new features that will give enterprise DevOps teams greater visibility into development pipelines, shortening time from idea to production regardless of what tool they’re using.
These new features will extend Atlassian’s flagship project Jira Software Cloud and will allow developers to visualize and measure progress and issues during continuous integration and continuous delivery, or CI/CD for short.
With DevOps teams depending on constant action and communication and a broad variety of tools this has also led to a mishmash of communication styles, application programming interfaces, dashboards, interfaces and interconnections.
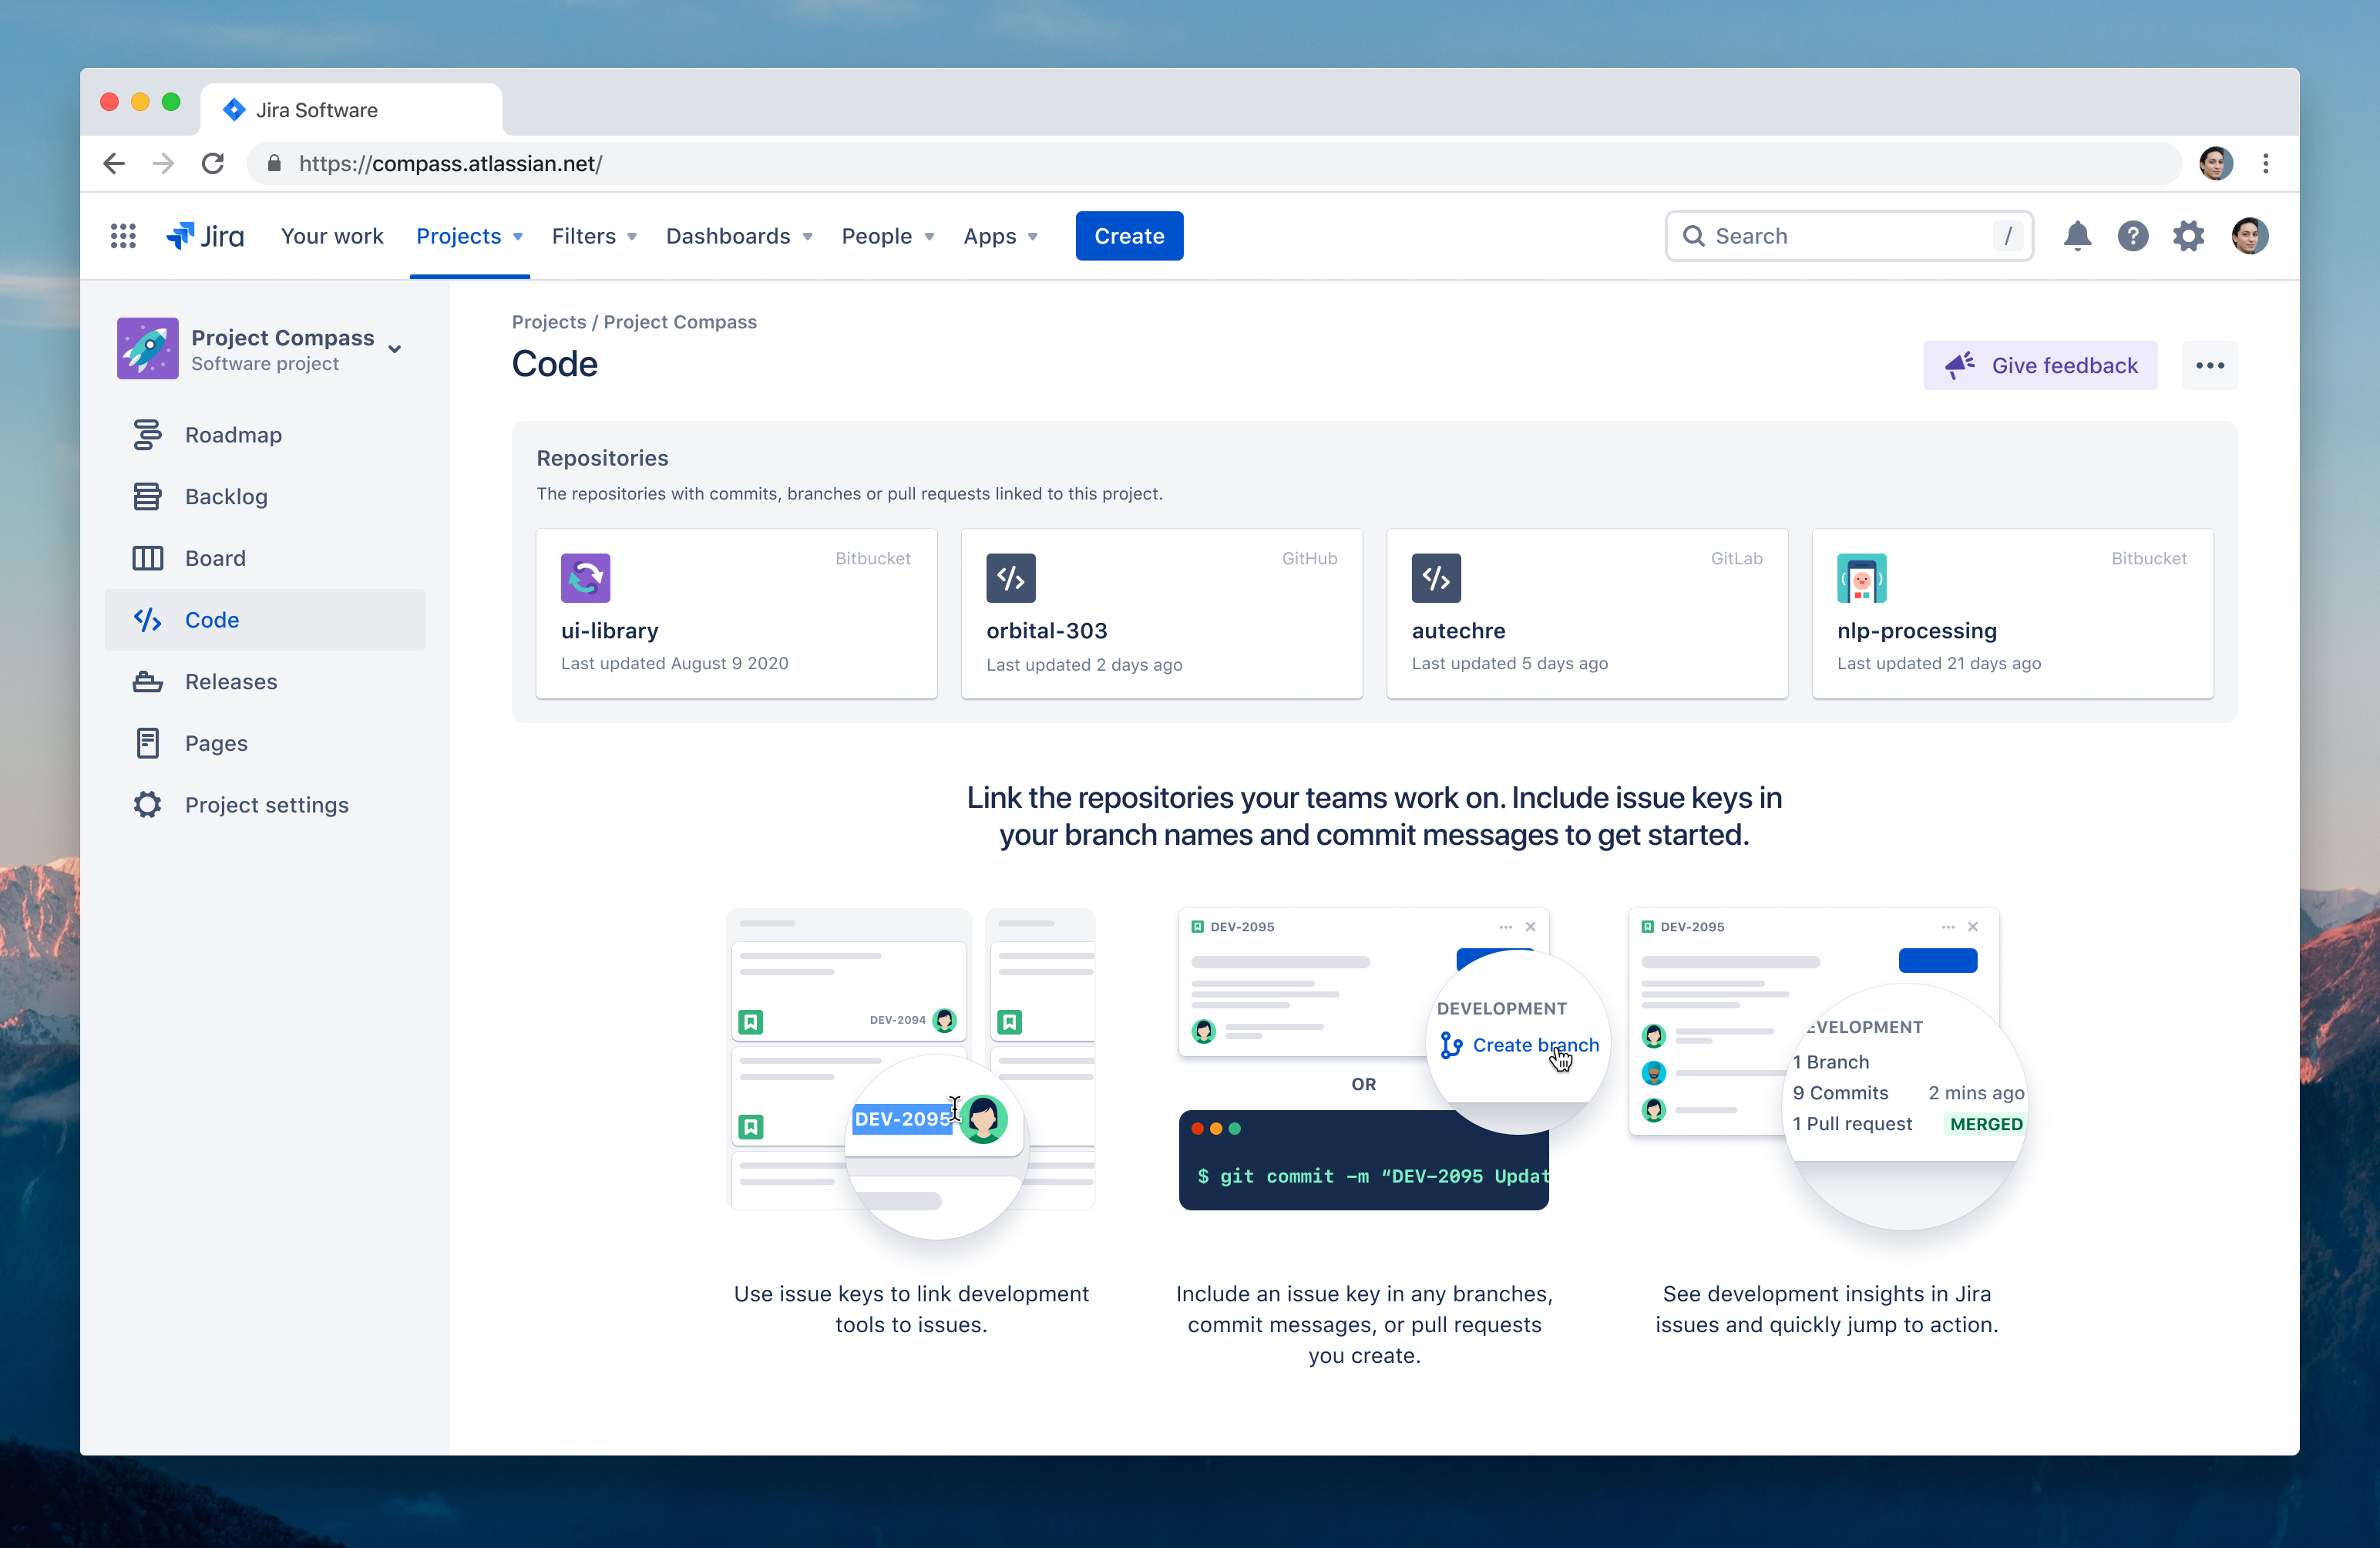
The four new features are “Code in Jira,” a team code repository surfacing feature; “Deployments in Jira,” a real-time view of where code deployment is in the CI/CD pipeline; “Deployment frequency” that has expanded to track performance across the entire CI/CD pipeline; and “Cycle time,” which now goes beyond just measuring average lead time.
With Code in Jira, DevOps teams can stay focused on code and avoid being disrupted by pings as often because every team can see who is working from which code repository at a glance.
Using Code in Jira, a dashboard user can simply open the backend and view the most recently active repos across Bitbucket, GitHub, GitLab or Git Integration – have it automatically surfaced – and then look at which team is using it. The result makes it obvious who is working on what.
Deployments in Jira enables anyone in the team to get a real-time view of where deployment is across any CI/CD provider. That means that any DevOps team member, be they a developer, project manager, team lead or executive, can get overall visibility of a project without having to walk into a cubicle and interrupt someone in the middle of a task to understand where a project is going.
With Deployment Frequency, the metric has been updated to track performance across the entire CI/CD pipeline for any provider. As a result, it can automatically calculate how often the team is shipping and how that’s trending over time so it’s not necessary to hold stand-up meetings to coordinate across tools manually or bother the ops team.
According to a study of the company’s own customers, Atlassian discovered that 74% of teams measured success through deployment frequency.
Finally, Cycle Time allows teams to go beyond measuring average lead time and track down a granular view of each segment of the development workflow. Since each piece of work across all Atlassian and third-party tools is tied to a Jira issue, it’s possible to identify bottlenecks and thus track down and fix them.
All four of these features roll out to DevOps teams today and will connect with Atlassian’s first-party and third-party tools, including more than 1,400 integrations through the company’s DevOps Marketplace.
Support our mission to keep content open and free by engaging with theCUBE community. Join theCUBE’s Alumni Trust Network, where technology leaders connect, share intelligence and create opportunities.
Founded by tech visionaries John Furrier and Dave Vellante, SiliconANGLE Media has built a dynamic ecosystem of industry-leading digital media brands that reach 15+ million elite tech professionals. Our new proprietary theCUBE AI Video Cloud is breaking ground in audience interaction, leveraging theCUBEai.com neural network to help technology companies make data-driven decisions and stay at the forefront of industry conversations.