


 CLOUD
CLOUD
CLOUD
CLOUD
CLOUD
Spending data shows that cloud, containers, artificial intelligence and automation initiatives are setting the stage for a strong rebound in tech spending next year.
The year 2020 has acted as a hasty but effective proof of concept for how to digitally transform businesses. Chief information officers report that generally, technology spending levels have either rebounded or will do so in the near future, setting up what could be a stronger 2021 than we’ve previously reported.
In this week’s Breaking Analysis, we’ll update our latest thinking on spending levels and priorities for the coming year. We’ll also share fresh Enterprise Technology Research data from its most recent COVID drill-down study.
Since early this year, we’ve been reporting our outlook for 2020 of a 4% to 5% drop in information technology spending. Despite a stronger third quarter than expected, we see no reason to alter that expectation. However, recent survey data and discussions with C-level executives lead us to believe that 2021 could exceed our 2% growth forecast and that figure could be as high as 4% to 5% in the coming year.
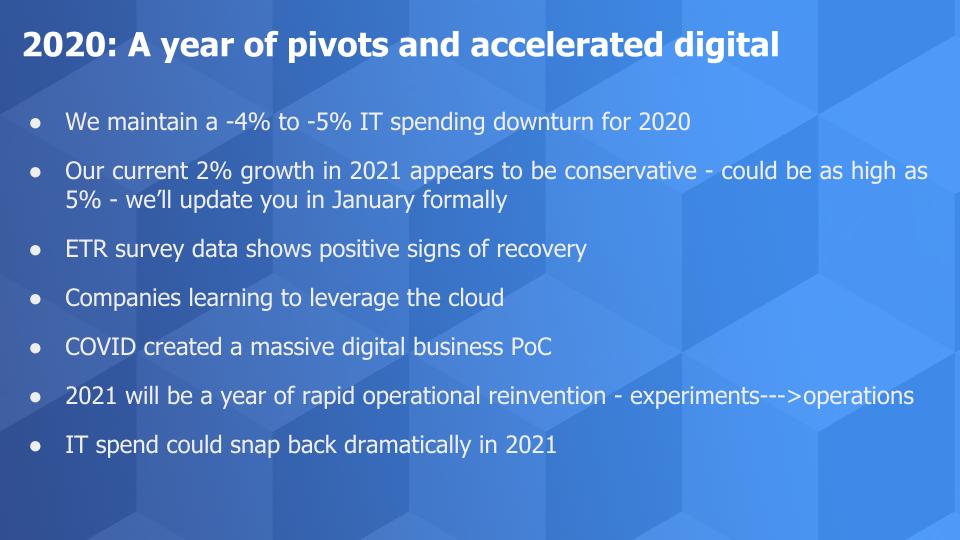
A better understanding of how to leverage the cloud, increased productivity, business transformation and recent ETR spending data suggest that digital business initiatives that have been accelerated are paying dividends. We believe CEOs and boards of directors are willing to double down on successful initiatives from the learnings of the past ten months.
Our research suggests that the digital experiment forced upon us by COVID-19 has created a dynamic where CXOs want to double down on sure bets and further compress the future. IT spending in 2021, we believe, will be the beneficiary.
While the overall spending momentum in the ETR survey data remains muted relative to 2018 and 2019, pointed questions asked of CIOs in the latest drill-down study give us reason for optimism. The chart below shows the responses to ETR’s November survey asking CIOs, “When do you see budgets returning to pre-COVID levels?”
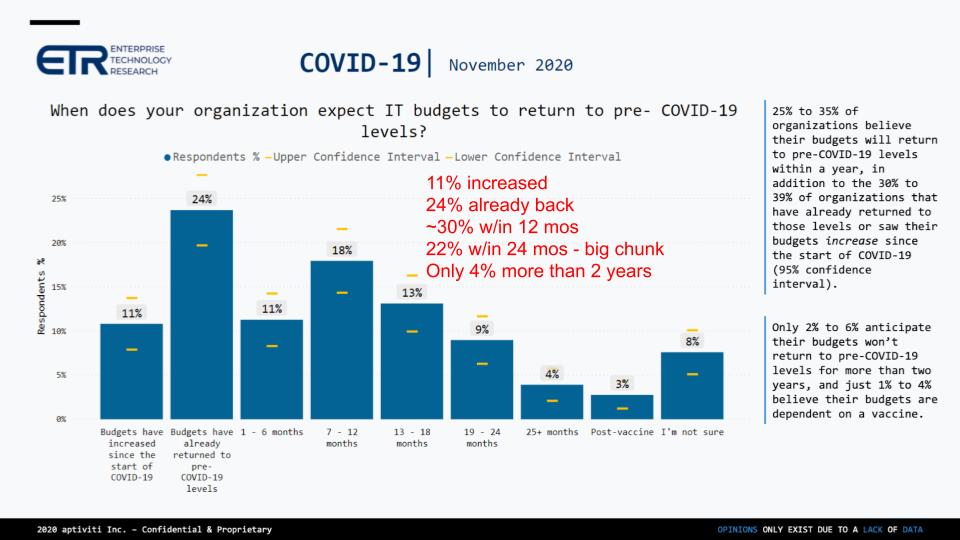
Historically, CIOs have been conservative in our view and so we’re keying on the upper end of the confidence interval in the data above. Although that may be an optimistic assumption, we believe it reflects both the reported earnings outlooks from major bellwether companies such as Microsoft Corp., Dell Technologies Inc., Hewlett Packard Enterprise Co., Cisco Systems Inc., Amazon Web Services Inc. and others, as well as the unreported upside and pent-up demand that we think exists in the global market.
The key figure to us in the above data is that only 4% of respondents feel spending levels won’t bounce back to pre-COVID levels for more than two years. And only an additional 20% believe this won’t occur until after 2021. Reasonable people can argue that there’s still a large portion of the survey that projects a negative outlook and that winter is coming in the northern hemisphere comprising the world’s largest economies. But with a vaccine coming soon, the clarity organizations have gained regarding the coming digital economy and muted spending in 2020, we believe there is more upside than downside to the forecast.
The chart below shows results from the COVID drill-down survey asking respondents to identify the factors that enabled business resiliency during the pandemic.
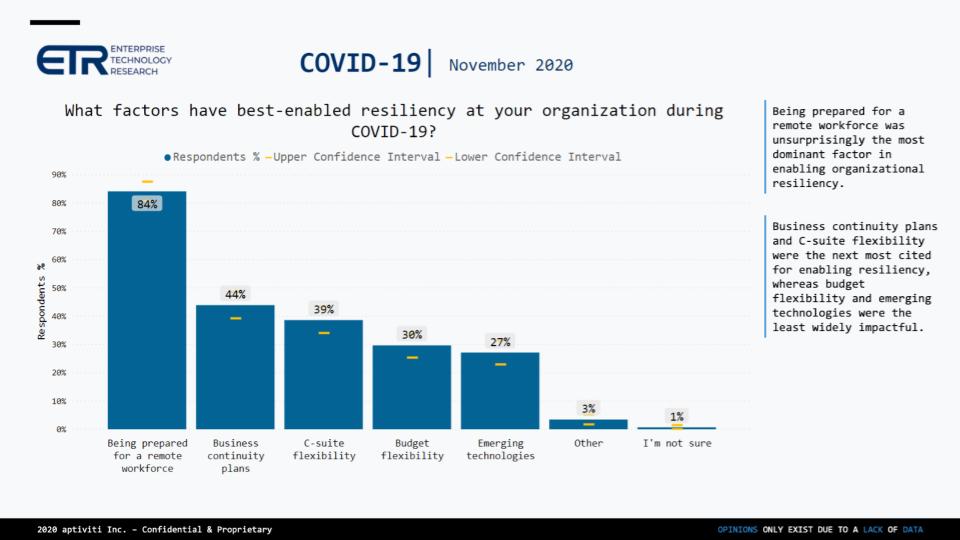
Not surprisingly, the ability to work remotely has been a critical factor. Forty-four percent of respondents cited Business Continuity Plans as a key factor. Several customers have told us, however, that their business continuity plans were far too focused on disaster recovery and as such they made tactical investments to shore up their digital capabilities.
C-suite backing and budget flexibility were cited as major factors. We see this as a real positive in that the corner office and boards of directors are tuned into digital. They understand the importance of getting digital “right” and we believe that they now have good data from the past 10 months on which investments will yield the highest payback. As such, we expect further funding toward digital initiatives. Balance sheets are strong for many companies as several have tapped corporate debt and taken advantage of the low interest rate climate.
Twenty-seven percent cited the use of emerging technologies as a factor. Some of these, it could be argued, fall into the first category – working remotely. The bottom line is we believe that the 10-month proof of concept that came from COVID puts organizations in a position to act quickly in 2021 to accelerate their digital transformations further by filling gaps and identifying initiatives that will bring competitive advantage.
We now want to better understand which technologies buyers are adding. It isolates the New Adoptions portion of the ETR Net Score methodology. Remember, Net Score looks at the percentage of customers Adopting New, Spending More, Spending Flat, Spending Less and Replacing. Net Score is calculated by taking (Adopting New + Spending More) – (Spending Less + Replacing). It is a measure of spending velocity.
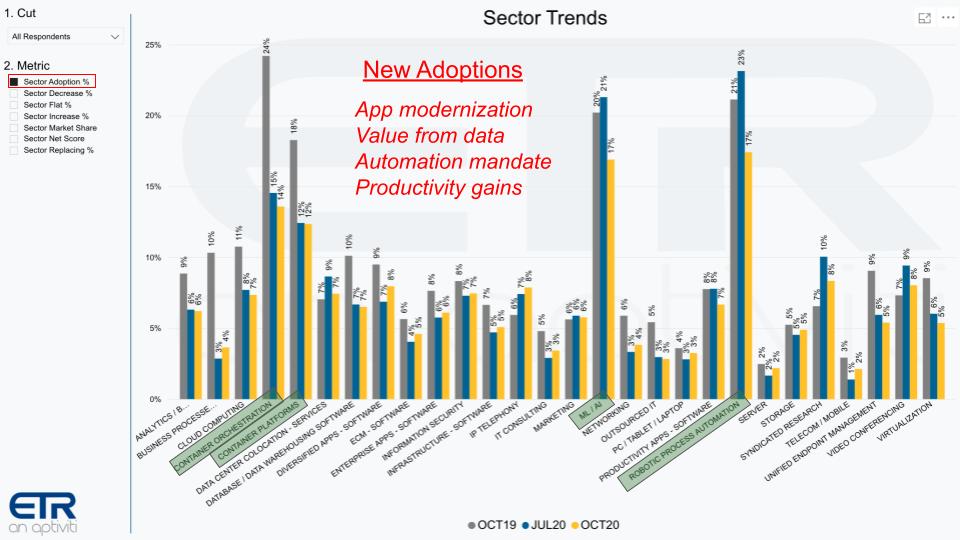
The chart above isolates on the New Adoptions portion of that detail. As you can see, the three top areas CIOs cite for New Adoptions related to containers, machine learning/artificial intelligence and robotic process automation. There are four takeaways from this data, in our view:
You may be looking at the previous slide and wondering: With all this talk about cloud migration, why isn’t cloud computing higher? The chart below addresses this question. It shows the percentage of customers using the ETR Net Score methodology and isolates on those areas where customers are increasing spending.
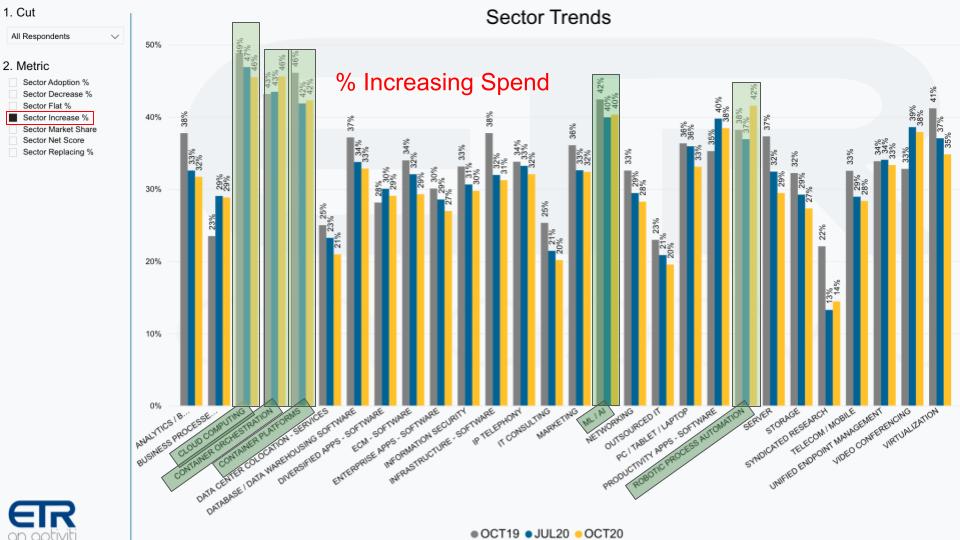
Note the elevated levels for Cloud Computing at 46%. This tells us that customers have generally already adopted some type of cloud computing model and they’re doubling down on that investment. Once again, we see containers ML/AI and RPA as areas where customers are spending more – above the 40% level. There are several other areas of increasing spending such as database, but these 40%ers are notable.
As we exit 2020, we’re watching four key factors in addition to our spending data:
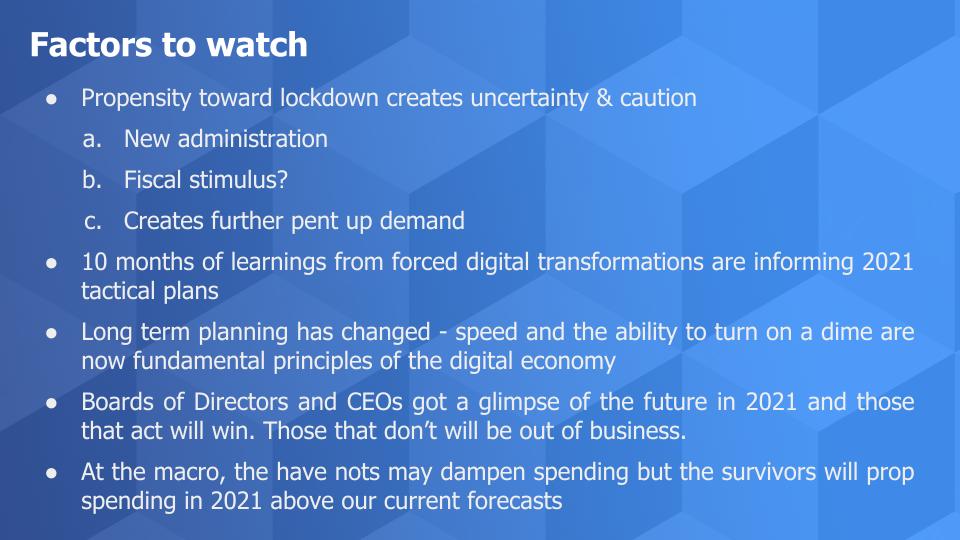
As a result, we believe that our 2% growth figure for 2021 could double to 4% or more.
Remember these episodes are all available as podcasts wherever you listen. Search “Breaking Analysis Podcast” and please subscribe to the series. We also publish a full report every week here and on SiliconANGLE. And check out ETR’s Web sit, as well as this ETR Tutorial we created, which explains the spending methodology in more detail.
Ways to get in touch: Email david.vellante@siliconangle.com, DM @dvellante on Twitter and comment on our LinkedIn posts.
Here’s the full video analysis:
Support our mission to keep content open and free by engaging with theCUBE community. Join theCUBE’s Alumni Trust Network, where technology leaders connect, share intelligence and create opportunities.
Founded by tech visionaries John Furrier and Dave Vellante, SiliconANGLE Media has built a dynamic ecosystem of industry-leading digital media brands that reach 15+ million elite tech professionals. Our new proprietary theCUBE AI Video Cloud is breaking ground in audience interaction, leveraging theCUBEai.com neural network to help technology companies make data-driven decisions and stay at the forefront of industry conversations.