


 CLOUD
CLOUD
CLOUD
CLOUD
CLOUD
Visual collaboration software company Lucid Software Inc. today announced a new tool today called Lucidscale, a cloud visualization product that enterprises can use to see, understand and optimize their often enormously complex cloud computing environments.
In an age when most large organizations operate extremely intricate cloud environments that are in a constant state of flux, the ability to make sense of them visually holds a lot of promise.
With Lucidscale, companies can automatically generate extremely accurate, dynamic cloud diagrams that illustrate their entire cloud environment. Using those diagrams, it should then be much easier to design, build and deploy cloud environments that encompass Amazon Web Services, Microsoft Azure and Google Cloud, and troubleshoot any problems that show up.
The advantages of being able to clearly see and understand your cloud environment are both fairly obvious and very significant. Lucid said Lucidscale makes it simple for companies to document their cloud environments and share them across teams of technical and non-technical users.
It helps users to visualize and understand the hundreds, if not thousands of components that make up a typical cloud environment. With this understanding, teams can then more effectively design future implementations and migrations. Furthermore, it can help teams to dissect problems more easily and understand the cause of outages, for example.
Other benefits include being able to verify that new cloud migrations and implementations are being done correctly and will work properly. They should, with any luck, also help companies to stay on top of compliance and security and ensure internal best practices are being applied.
The company already provides cloud environment visualizations through its existing Lucidchart Cloud Insights tool, but Lucid Chief Product Officer Dan Lawyer told SiliconANGLE that customers were demanding an entire experience that helps them to see, understand and optimize their cloud infrastructures.
“This standalone product, designed for cloud architects, cloud engineers and other cloud professionals, gives us the opportunity to put the most important functionality front and center, giving users a simpler interface and more tailored experience,” he said.
Lucidscale also provides additional functionality, such as the ability to customize different views of cloud environments and save those views for easy reuse. Other features include a more robust data hub and panel that enables better management of multiple datasets across cloud providers, Lawyer explained.
Lawyer said most organizations today are still managing their cloud environments with inventory lists or manually produced diagrams that require updates by hand each time changes are made to the underlying infrastructure, neither of which are ideal solutions.
“There are standard tools that allow for people to manually diagram their infrastructures, and then there are other tools that offer similar benefits without the detailed diagrams,” he said. “There are a few smaller players that allow for some cloud visualization and documentation, but without the depth of customization and not at the scale that we’re able to provide.”
The benefits of Lucidscale are perhaps best appreciated visually. Here’s what users see typically see when looking at their AWS cloud environment via the AWS console:
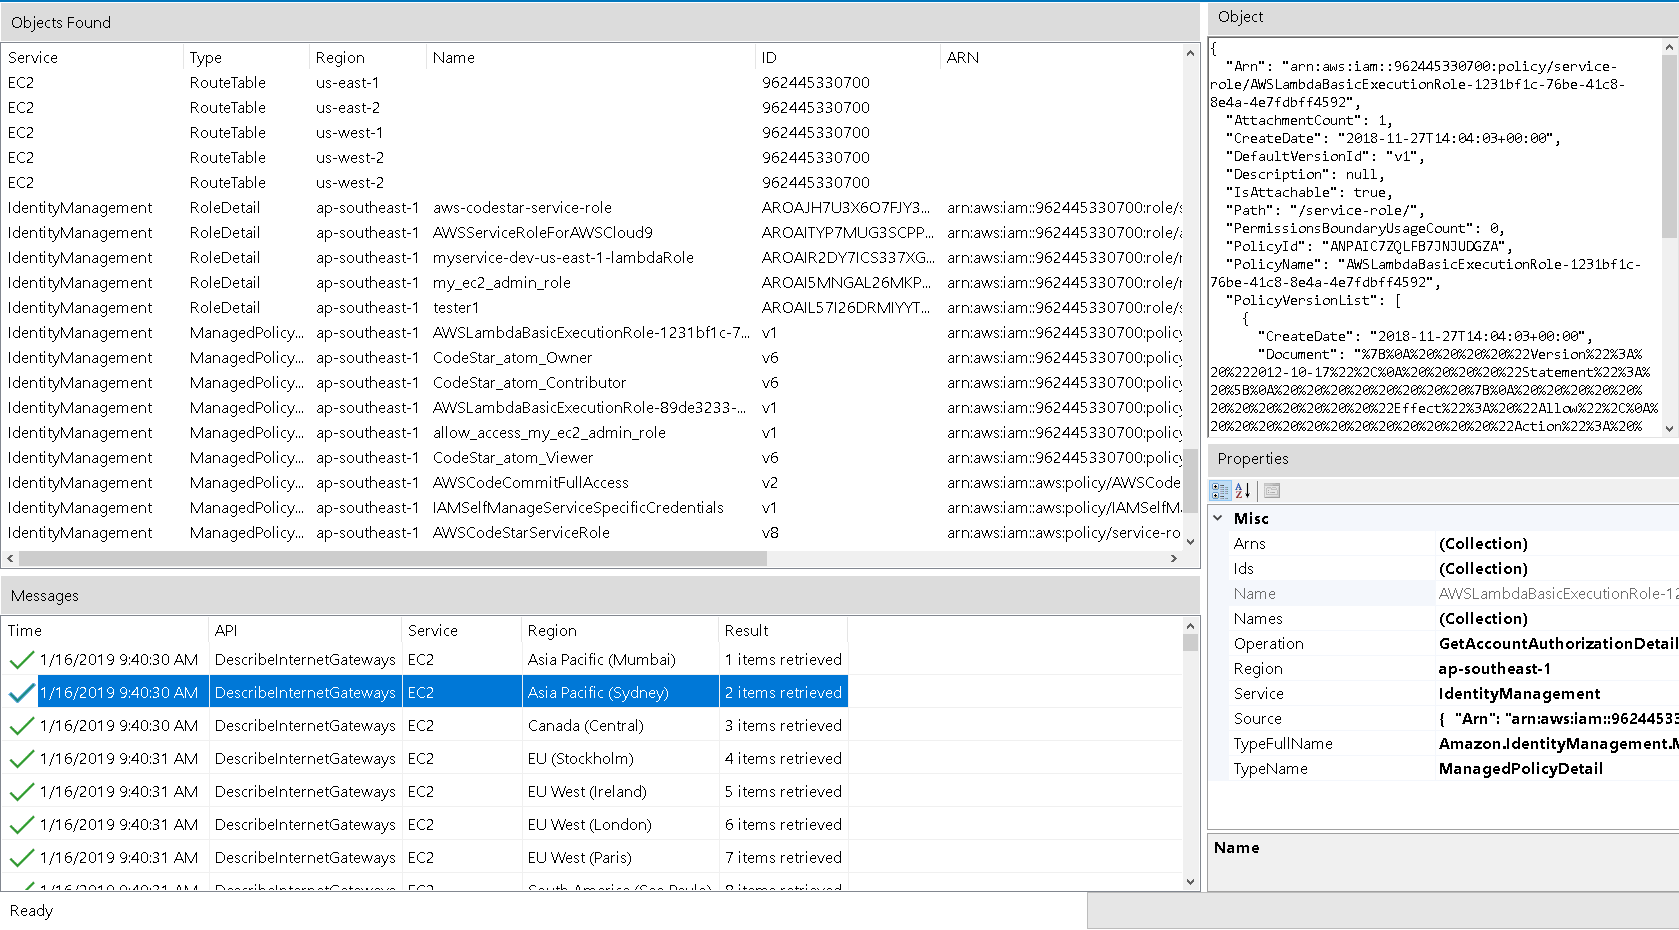
It’s not pretty and cloud architects can be forgiven for finding it hard to follow. On the other hand, they should feel right at home with Lucidscale’s colorful interface:
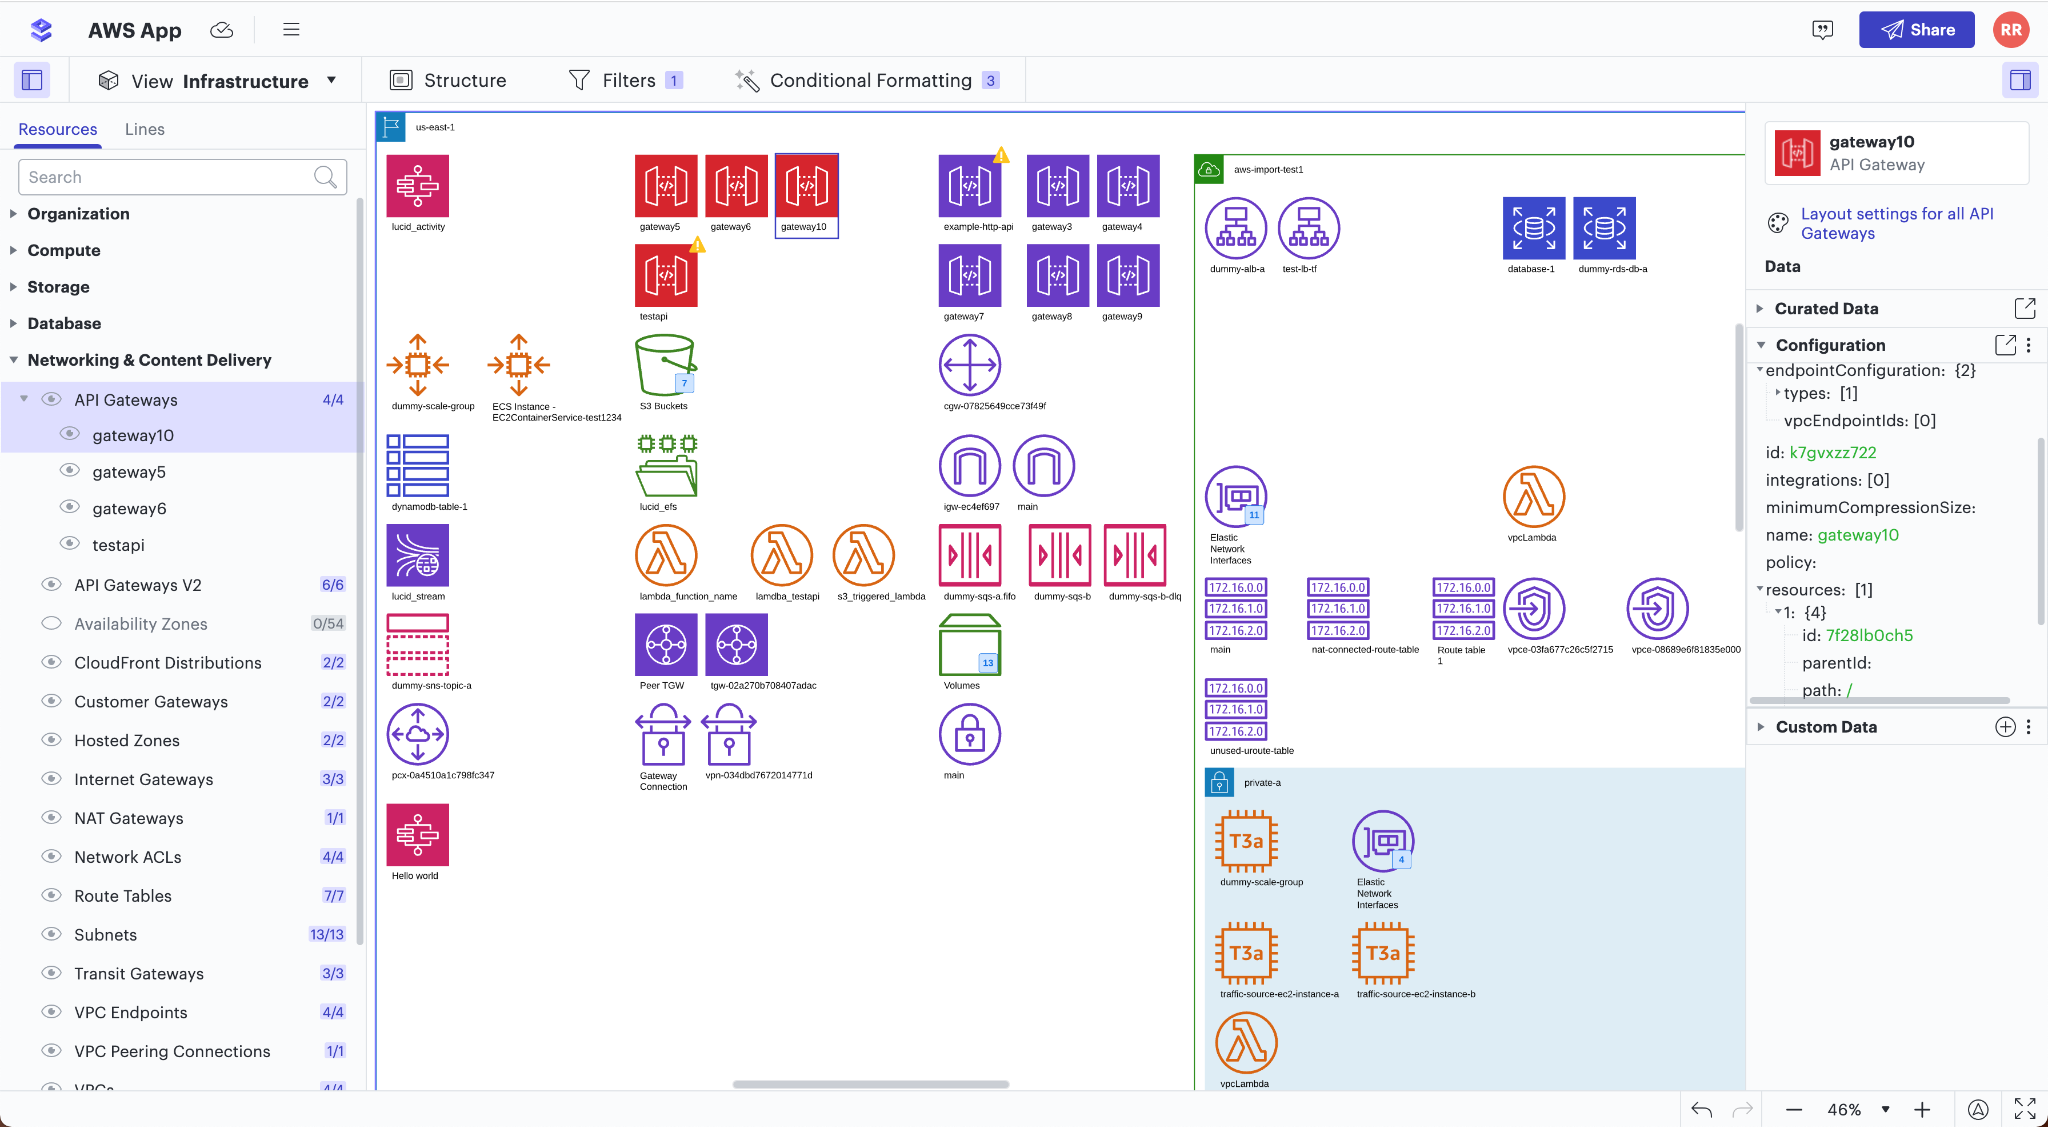
The difference is compelling, and Lucid co-founder and Chief Executive Karl Sun argues this level of visibility into cloud environments is a necessity for companies that want to adapt quickly, plan and scale.
“Teams also require new levels of technical alignment and understanding across a variety of stakeholders,” he said. “Lucidscale enables both technical and nontechnical users to make better cloud decisions and understand and optimize their cloud environments using visuals to generate, maintain and update accurate, dynamic cloud diagrams.”
Analyst Holger Mueller of Constellation Research Inc. agreed that it can be difficult for enterprises to stay on top of their sprawling cloud landscapes, especially when they’re running hundreds of different applications on them.
“One of the most powerful tools and strategies to reduce complexity is visualization,” Mueller said. “Lucid is following exactly that approach, providing what look to be very powerful visualizations of enterprises’ digital footprints.”
Lucid has picked up quite a following thanks to its existing Visual Collaboration tools, which include Lucidchart, an intelligent diagramming application that’s used to automatically create flowcharts and diagrams, including linking data to shapes, creating org charts and visualizing AWS network architecture. The company’s other product is Lucidspark, a virtual application whiteboard that enables developers to work together, brainstorm ideas and work out how to implement them, in real-time from any location.
Lucidscale is generally available starting today.
Support our mission to keep content open and free by engaging with theCUBE community. Join theCUBE’s Alumni Trust Network, where technology leaders connect, share intelligence and create opportunities.
Founded by tech visionaries John Furrier and Dave Vellante, SiliconANGLE Media has built a dynamic ecosystem of industry-leading digital media brands that reach 15+ million elite tech professionals. Our new proprietary theCUBE AI Video Cloud is breaking ground in audience interaction, leveraging theCUBEai.com neural network to help technology companies make data-driven decisions and stay at the forefront of industry conversations.