 CLOUD
CLOUD
 CLOUD
CLOUD
 CLOUD
CLOUD
Recently leaked court documents during Microsoft Corp.’s ActivisionBlizzard hearing require us to revisit our cloud forecasts and market share data. The poorly redacted docs, which have since been removed from public viewing, suggest that Microsoft’s Azure revenue is at least 25% lower than our previous estimates.
As a result, we’ve cut and revised our Azure revenue figures, which in turn increases Amazon Web Services Inc.’s Big Four hyperscale cloud market share. Our new estimates show that AWS maintains a greater than 50% share of revenue through 2023. Although the change also helps Google Cloud, its market share is only modestly affected.
In this Breaking Analysis, we update our hyperscaler cloud revenue estimates and market share data. We’ll also explain how the Enterprise Technology Research data on cloud should be interpreted in this context and look forward to potential catalysts for cloud growth, including acceleration in the fourth quarter attributable to generative AI.
The story was well-covered in the press. The media picked up on Google analysis in late 2022 on a similar manner, but the Activision hearing let the cat out of the bag… oops!
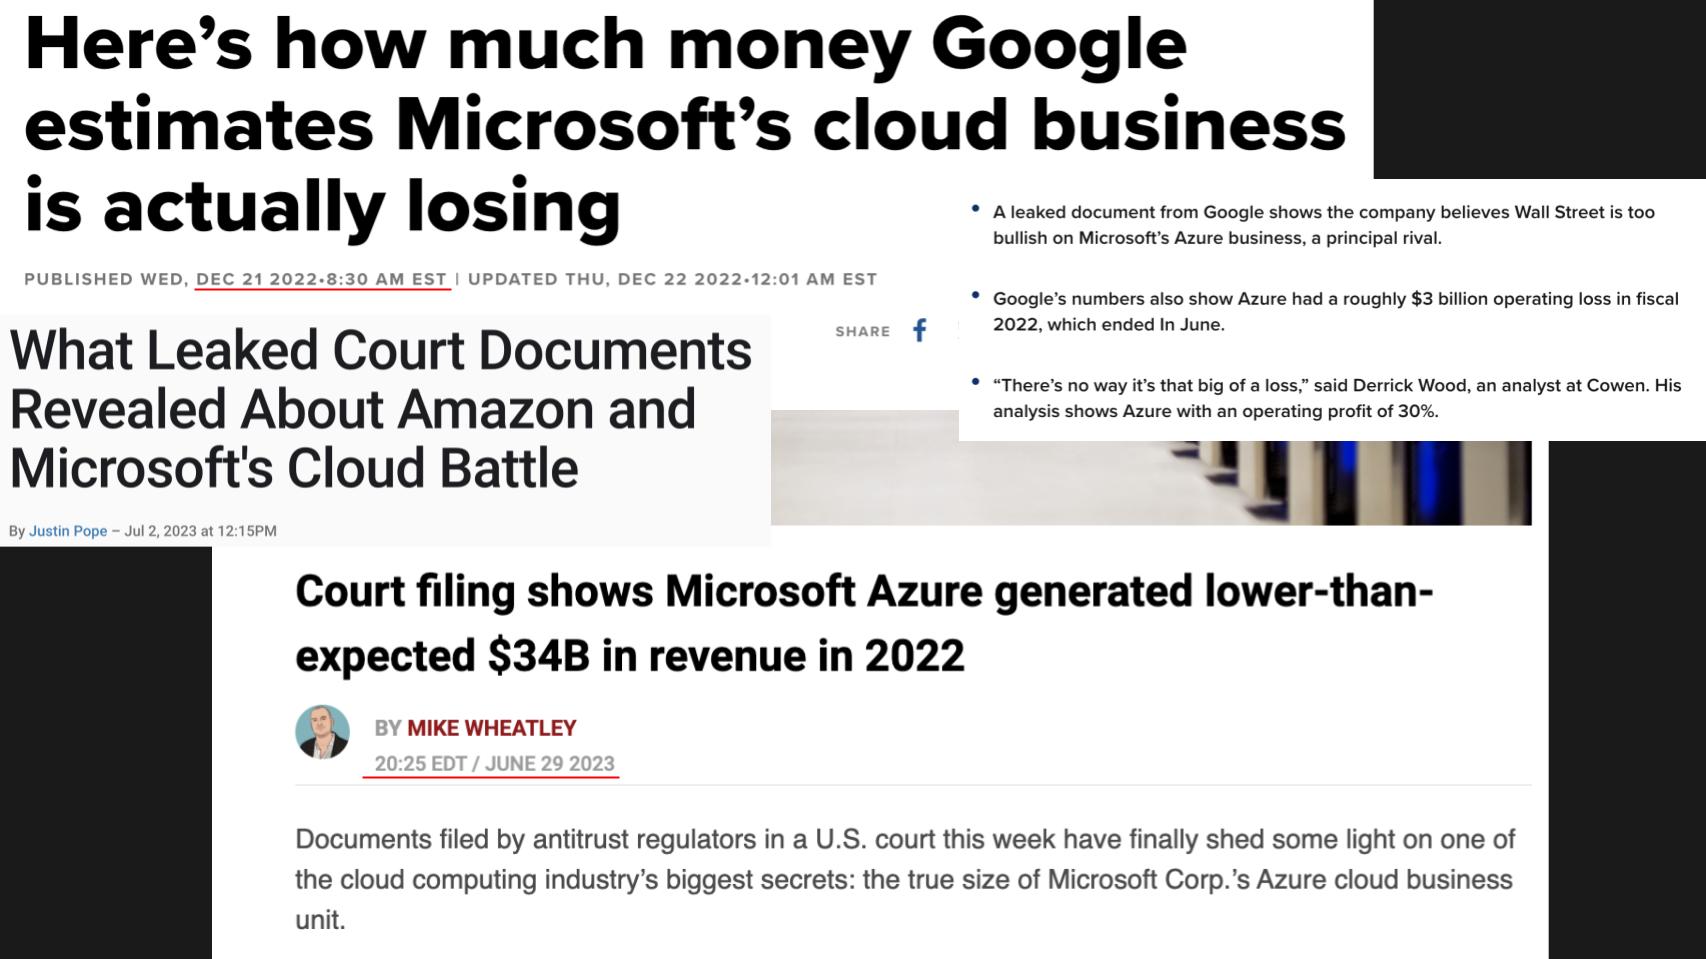
Last month as part of the Federal Trade Commission’s attempt to block the Microsoft-Activision deal, Microsoft submitted redacted documents to the court that pegged its Azure revenue for its fiscal 2022 at $34 billion. That’s the four periods from June 2021 to June 2022. It’s more than $10 billion lower than most analyst estimates, including ours.
How are we to interpret this data? On the one hand, it helps Microsoft show data that it has significant competition in the cloud and doesn’t have a monopoly. Further, Microsoft can basically put revenue in whichever bucket it wants. Moreover, no one can seem to get hands on the poorly redacted documents to see the exact context.
For example, here’s some detail we’d like to see: Microsoft claims to have a $20 billion cybersecurity business. Is any of that revenue counted in Azure? If so how much? If not, why not?
Regardless of the many questions, this revelation can’t be ignored. It’s highly unlikely that Microsoft would produce data in court documents that would not be consistent with how it reports its business internally. So we have to adjust our cloud figures.
Before we get into the revised data, let’s remind you that only AWS reports its infrastructure-as-a-service and platform-as-a-service data in a reasonably clean manner. Microsoft reports Azure growth rates and Alphabet Inc. gives hints about its IaaS and PaaS businesses. But neither gives specific revenue figures. Below we show some examples. 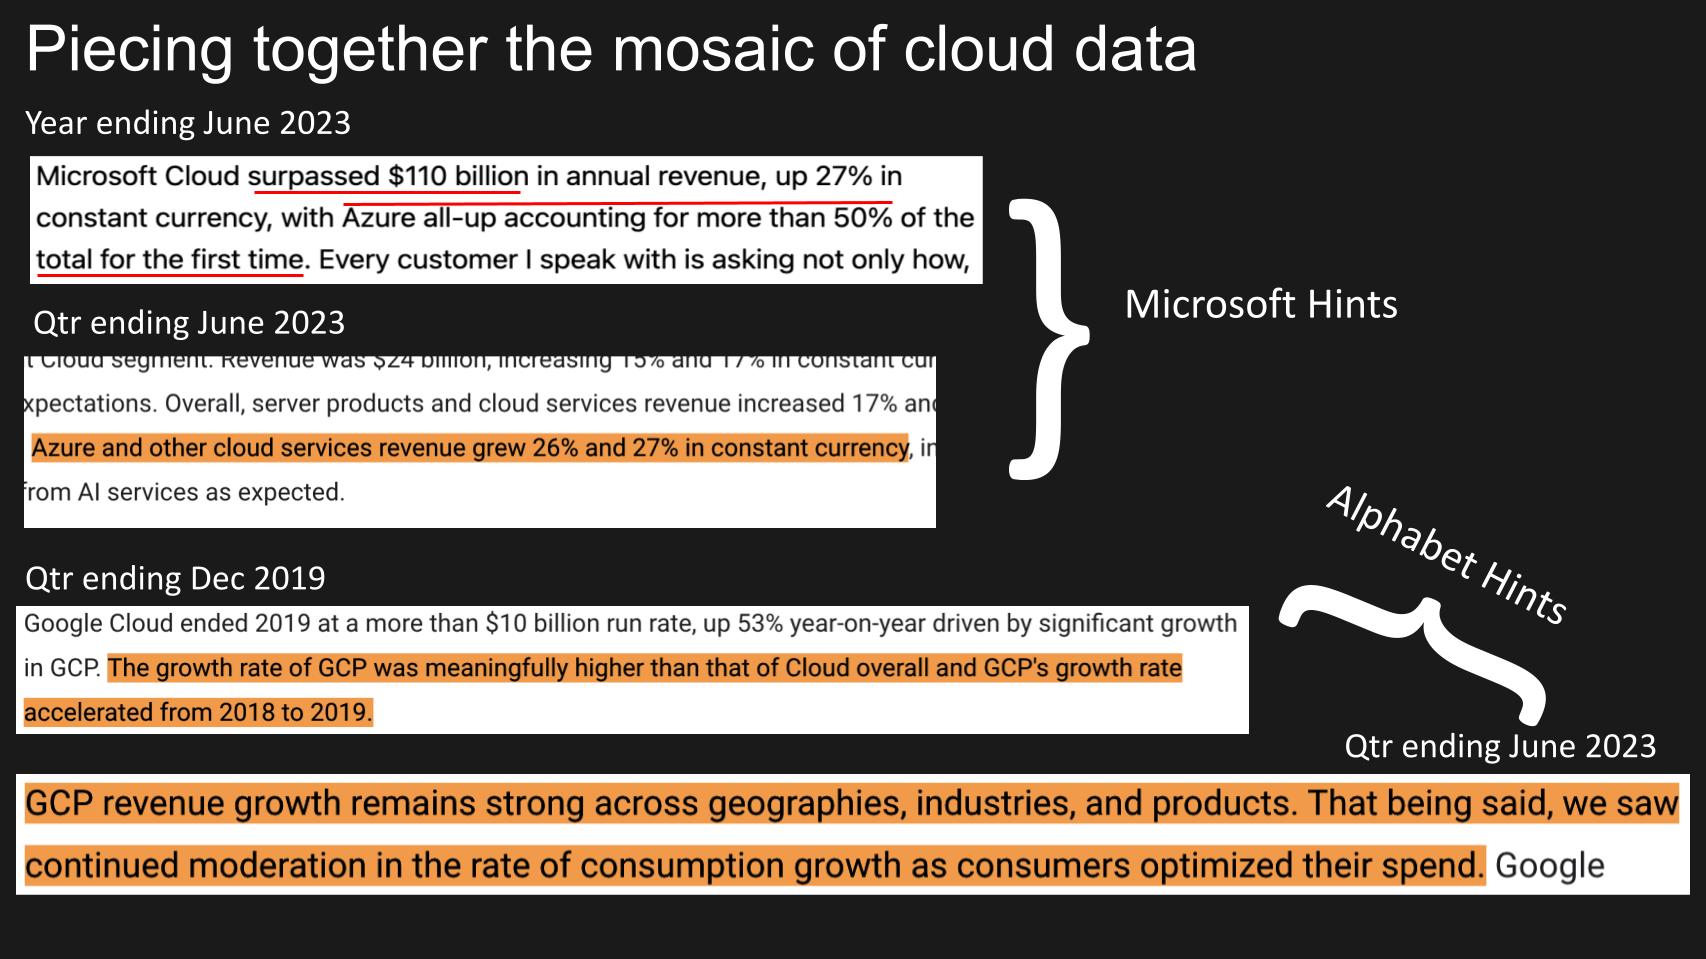
In this past earnings print, Microsoft gave more information than it ever has regarding Azure. The company cited that Azure’s annual revenue, for the first time, surpassed 50% of the Microsoft Cloud total, a figure it always reports. Microsoft consistently gives specific figures on Azure growth rates each quarter.
Taking those into consideration as gospel and pinning fiscal year 2022 at $34 billion (the leaked figure), we can get close to 50% but not quite. So we’re left asking ourselves: Which figures are correct? The quarterly growth rates or the most recent disclosure? And how reliable are the leaked numbers?
We’ve always been dubious of the $34 billion leaked figure and felt the number was larger. But given the lack of transparency, we’ll err on the conservative side and have decided to reduce Azure’s revenue in our model.
So what does this mean for our previous forecasts? Let’s take a closer look at the data.
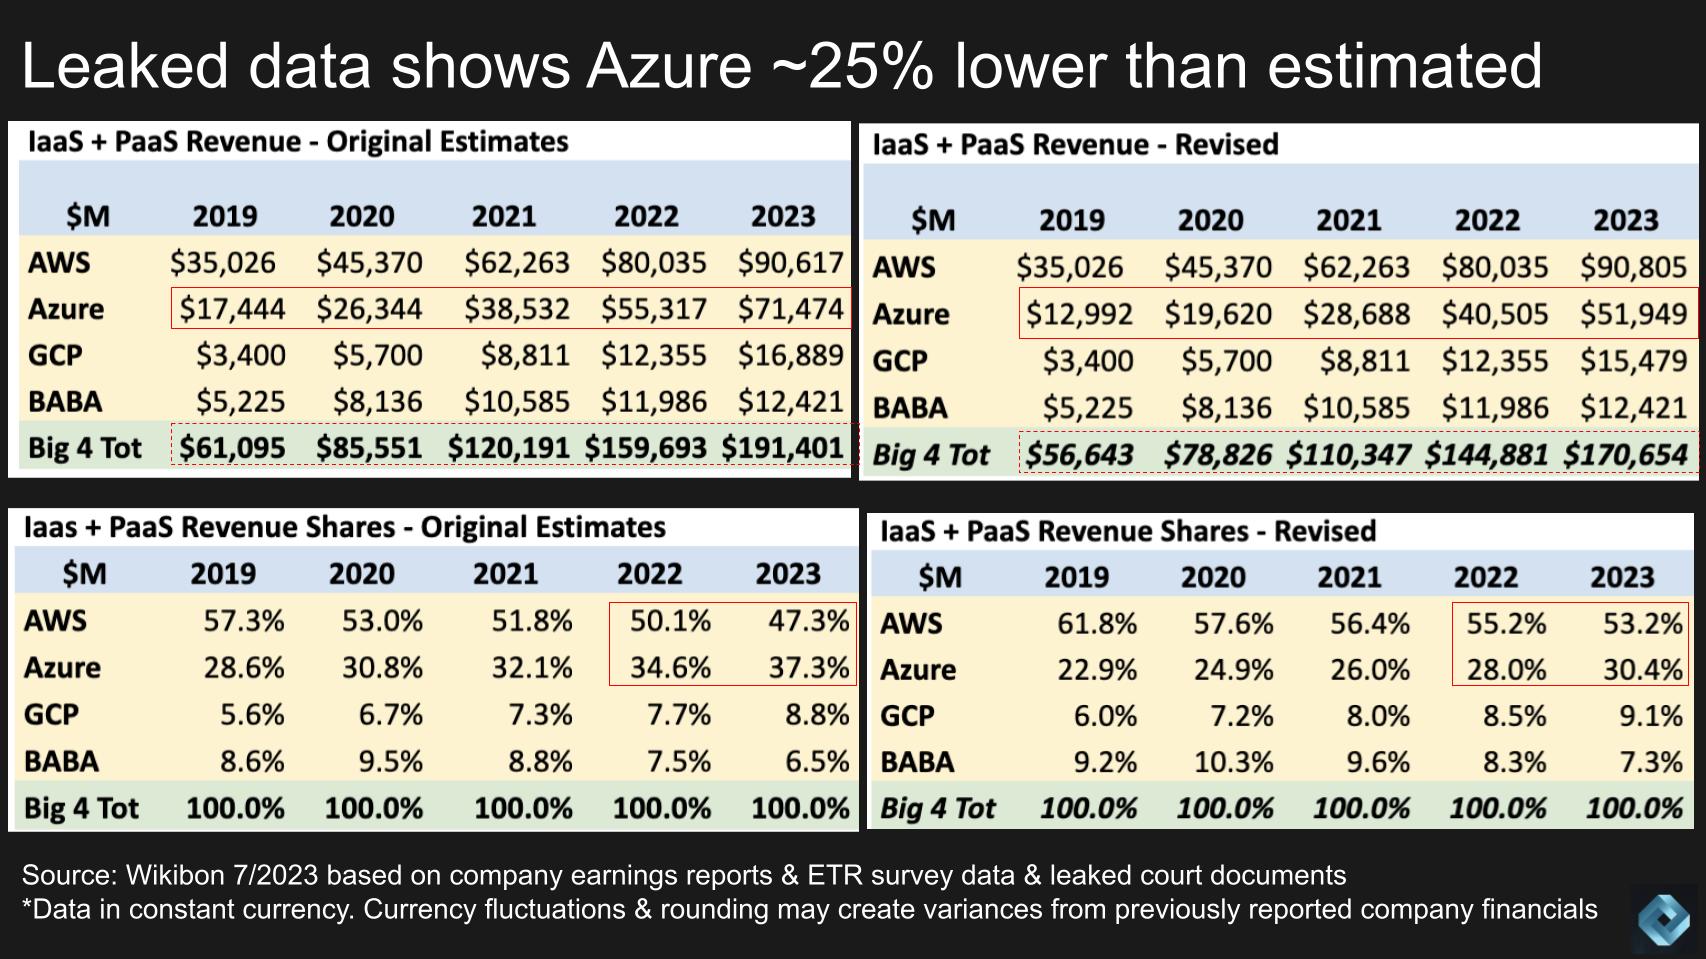
Above, on the lefthand side of this graphic, we show our previous estimates for the Big Four hyperscalers. The top chart is worldwide IaaS and PaaS revenue and the bottom is market share data prior to the leaked documents.
On the right hand side we show the same data for our revised estimates. Let’s review the meaningful changes:
Lastly, the overall market size in our model has been reduced by approximately 10%. We’ve revised our Big Four 2022 revenue down to around $145 billion, growing 18%, to $171 billion, in 2023.
You may be wondering how could the estimates published in Breaking Analysis and other Wall Street numbers be so far off? The simple explanation is we’ve relied too heavily on customer data. When asked about cloud usage, customers report a large portion of their software-as-a-service spending as cloud. Our ETR partners survey quarterly and ask more than 1,700 information technology decision makers about their spending on cloud and other sectors. The chart below shows this dynamic in more detail.
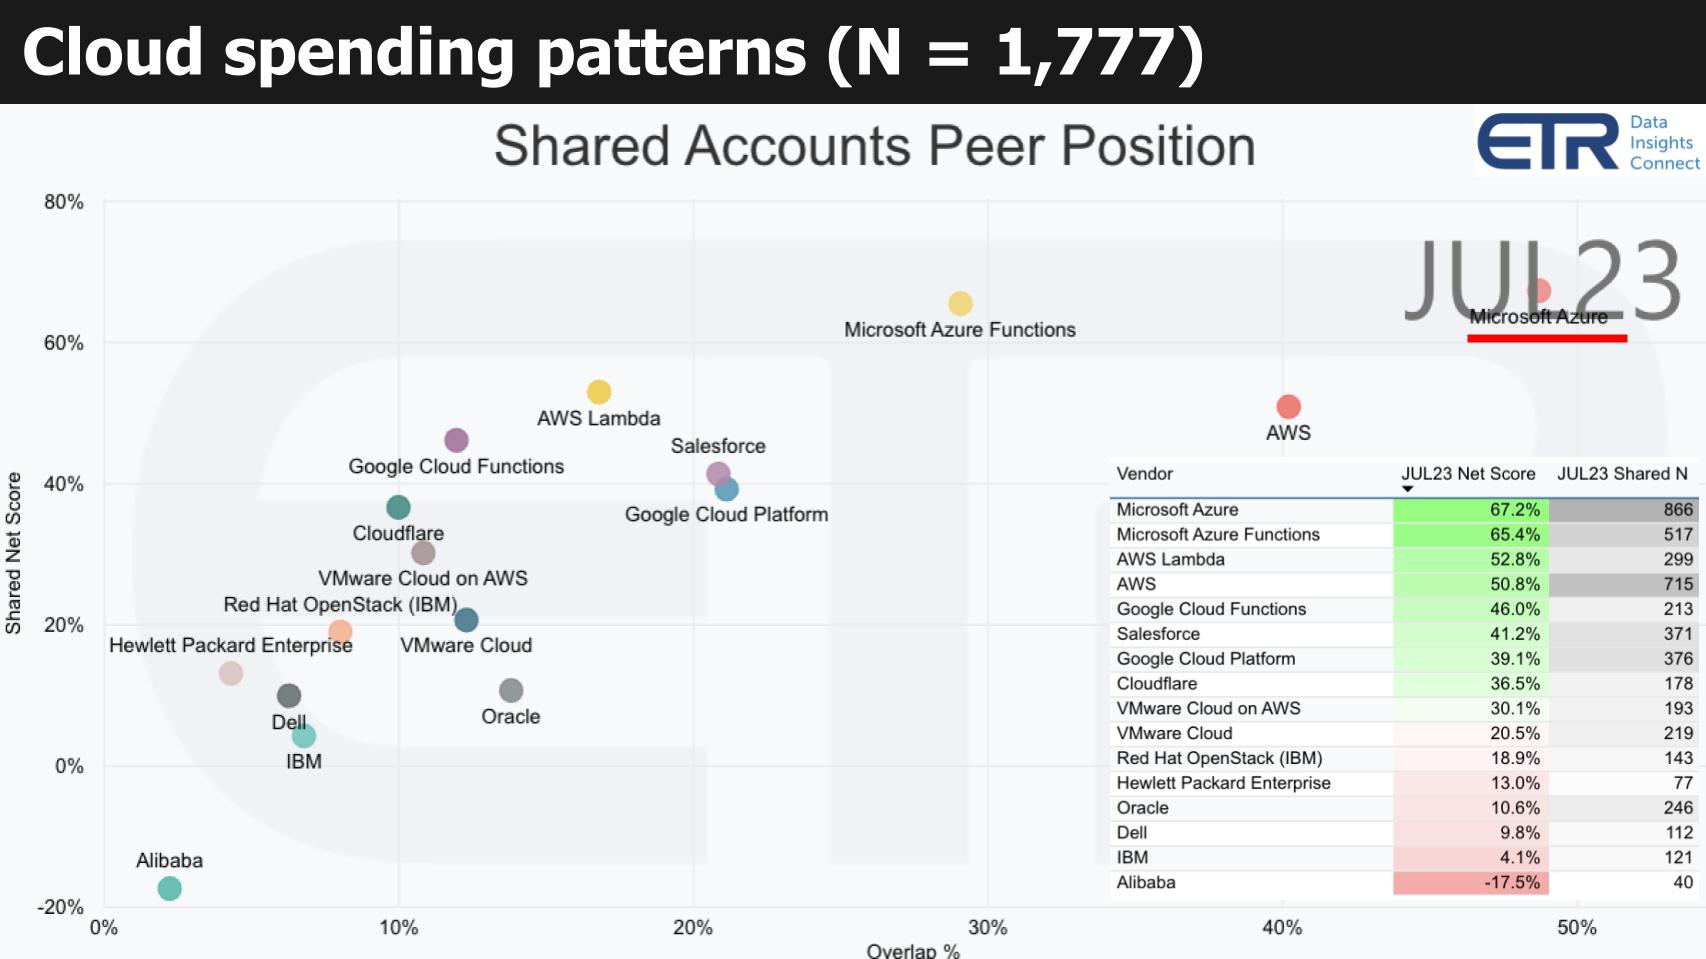
The data above shows Net Score or spending momentum on the vertical axis and the penetration within the ETR data set on the horizontal axis. The table insert at the bottom right shows the key performance indicators for each company and informs the position of the plot.
Microsoft is shown in the upper right. It consistently shows the strongest performance in the ETR data set. As we’ve explained before, we’ve always suspected that much of that performance is the result of the previous explanation – customers including SaaS spend in the cloud category. Although we’ve consistently tried to correct for this anomaly in our forecasts, if the court leaks are to be believed, we have to concede we didn’t adjust the figures enough to the downside.
Note: We’re still not convinced the court documents are an accurate reflection of Microsoft’s Azure revenue. If you pin Azure’s FY ’22 numbers at $34 billion (the leaked figures) and model against Microsoft’s stated Azure growth rates, you can’t quite get to the implied $55 billion in FY ’23 that Microsoft just disclosed. In fact, if you ignore the leaked figure and model on the 50% disclosure, it suggests that our original forecasts were within 10% of Microsoft’s recently disclosed figures.
But given the lack of transparency, for now, we’ll go with the lower Azure figures.
As further evidence supporting our supposition, Salesforce Inc. shows up in the above graphic. In addition, as we’ve shared in previous research, Snowflake Inc. bundles AWS infrastructure costs in its service fees. It’s why we suspect that customers cite database costs as the most prone to surprises on the cloud bill.
The strength of a time series survey like ETR’s is its consistency over time, which gives analysts the ability to identify and interpret changes. ETR is constantly evolving its taxonomy and granularity and has some plans to address such anomalies in the future.
As well on the above graphic, other firms and services show up in the ETR data set, including the functions offerings from all three big U.S.-based cloud players. Cloudflare Inc. has also begun to show up in the cloud computing sector of the taxonomy and has strong momentum as it builds out a new type of secure network. VMware Inc. – both VMware Cloud on AWS and VMware Cloud Foundation or VCF — are prominent, as is OpenStack, which is popular for so-called sovereign clouds. Oracle Corp. and IBM Corp. have always had a presence in the data.
New names are also showing up in the data, notably Hewlett Packard Enterprise Co. with GreenLake and Dell Technologies Inc. with APEX. Although their spending velocity is not high, both companies have a reasonable N in the data, with Dell somewhat higher in presence and HPE higher with spending velocity.
Lastly, we show the Alibaba Cloud data as it’s another data point. It’s questionable how much the ETR data reflects Alibaba’s actual market performance, but directionally it has come down dramatically in the data set, which aligns with Alibaba’s troubles in China.
Let’s talk about some of the things we’re watching in the market and some potential catalysts that could move the market.
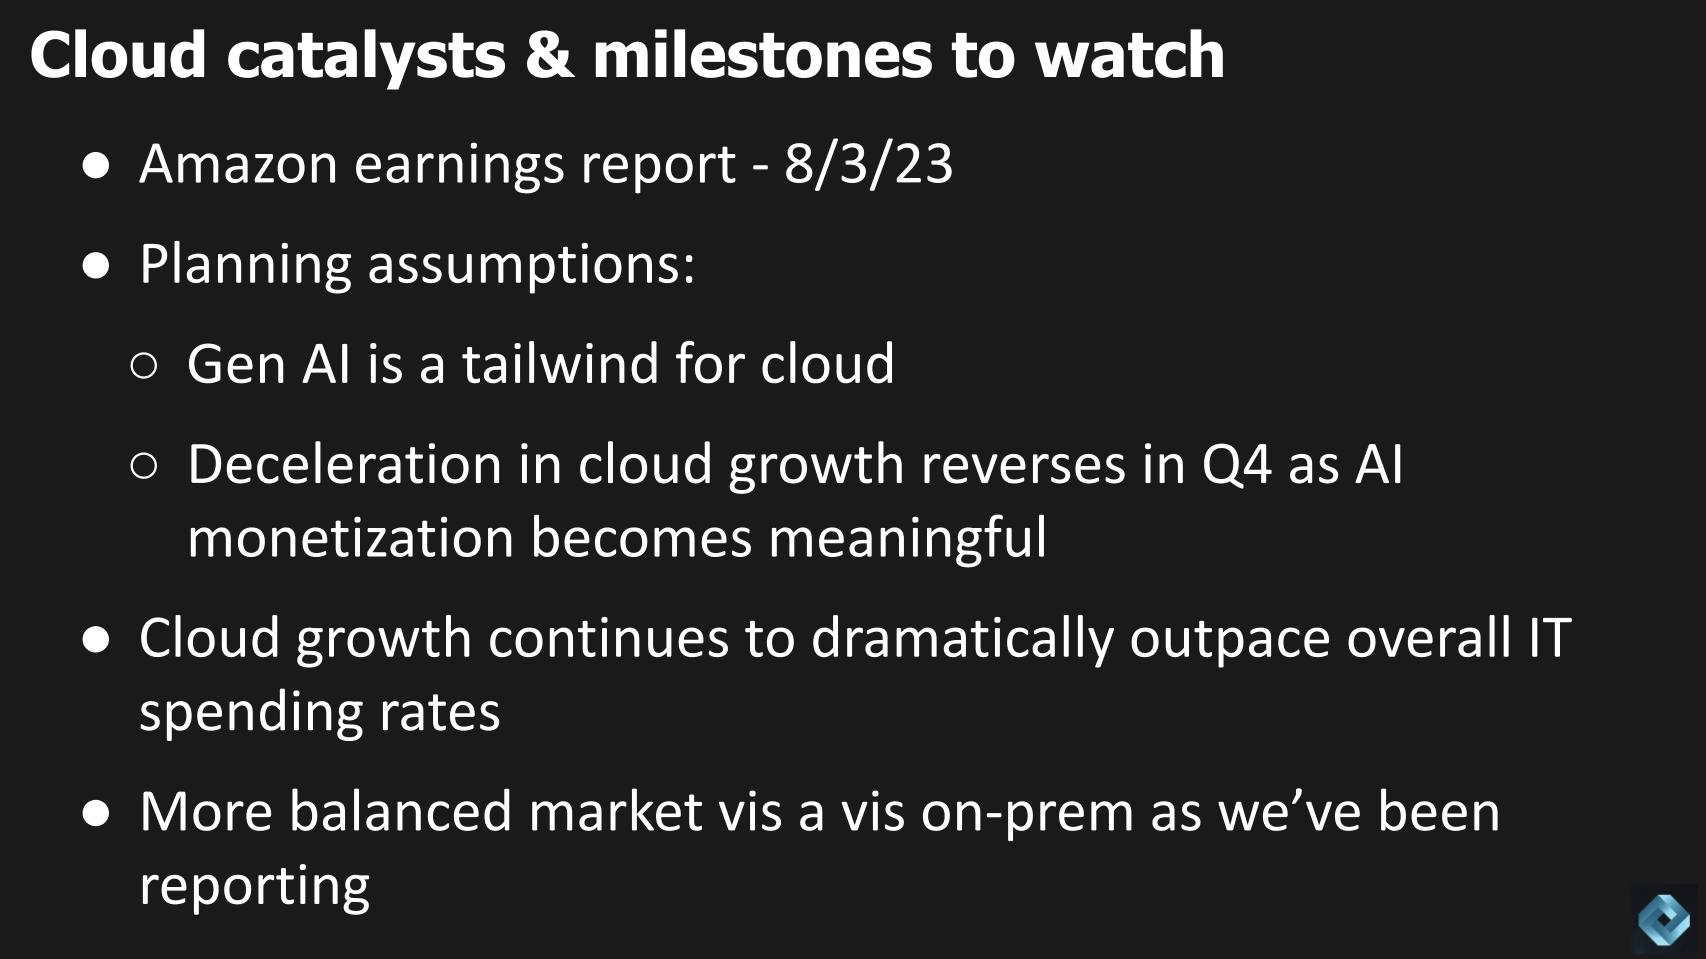
Amazon.com Inc. reports earnings on Aug. 3. We expect that cloud deceleration will moderate and AWS growth might actually accelerate a bit sequentially.
In addition, we’re working with the following planning assumptions:
We’ve reported in our research that rebalancing and cloud optimization. We’re not repatriates just yet, but we have talked about been watching the Charles Fitzgerald’s repatriation index. It measures the revenues of Digital Realty plus Equinix and divides by AWS revenue. The index bottomed last quarter and bounced up slightly. We’ll see how it does this quarter. We would suspect it’s not going to show a dramatic reversal, but data suggests we’re hitting a sort of equilibrium.
On this last point, we want to call your attention to a piece of research that was recently published by Dion Hinchcliffe of Constellation Research. He interviewed more than 20 chief information officers. As our research has indicated, the market is becoming more balanced between cloud and on-prem. Cloud is still growing significantly faster, but work that isn’t in the cloud will be tougher to move. Why? Because: 1) The cloud operating model is coming to a data center near you – that is, the on-prem guys are leaning into as-a-service such as APEX and GreenLake; 2) Their offerings are more robust than AWS’ Outposts and better-suited for the on-prem installed base; and 3) The work that is on-prem has characteristics that favor keeping the data where it is.
That’s what Dion’s research articulates very nicely and we show below.
We won’t in-depth here but Dion did a very nice job of laying out the decision points for where work should be placed with some industry considerations and examples of notable use cases. And he provides a framework for understanding the salient characteristics of work that is best suited on-prem versus in the public cloud. We would encourage you to take a look at the research.
As we said earlier, despite this state of balance, we believe generative AI will be a tailwind for the hyperscalers. All companies leaning in will benefit, but we think the hyperscalers are best positioned: AWS with Sagemaker and Bedrock, and its custom silicon and other tooling; Google with its AI prowess; and Microsoft, which jumped to the mindshare lead with OpenAI.
These platforms are all prominent in AI today. They don’t have to “AI wash” to be in the game because they’ve been in it for a while. As such, we expect generative AI will benefit cloud consumption for new workloads.
Further, we believe that the Big Three clouds in the U.S. will have dominant positions in large language models. And others such as OpenAI and Anthropic, and the like will play. But there will only be a handful of giant LLMs, in our view. There will be many more smaller models that use proprietary data in various industries and use cases.
In addition, there’s a business case for AI coming on-prem, so we’ll be watching that closely. ETR data shows that 96% of companies in a recent survey either have or are formulating an AI strategy. Sixty-four percent say it will increase their infrastructure needs. And 30% say it will accelerate their cloud spend. So this is something we’re watching. Does that gap suggest that we’ll see a resurgence on on-prem/hybrid spend around AI?
The key will be the degree to which the traditional players can integrate generative AI and establish credibility in the market — and how fast they can actually build these AI capabilities into their as-a-service offerings, and build partnerships with teeth.
“AI or Die” is the new slogan for all.
Many thanks to Alex Myerson and Ken Shifman on production, podcasts and media workflows for Breaking Analysis. Special thanks to Kristen Martin and Cheryl Knight, who help us keep our community informed and get the word out, and to Rob Hof, our editor in chief at SiliconANGLE.
Remember we publish each week on Wikibon and SiliconANGLE. These episodes are all available as podcasts wherever you listen.
Email david.vellante@siliconangle.com, DM @dvellante on Twitter and comment on our LinkedIn posts.
Also, check out this ETR Tutorial we created, which explains the spending methodology in more detail. Note: ETR is a separate company from Wikibon and SiliconANGLE. If you would like to cite or republish any of the company’s data, or inquire about its services, please contact ETR at legal@etr.ai.
Watch the full video analysis:
All statements made regarding companies or securities are strictly beliefs, points of view and opinions held by SiliconANGLE Media, Enterprise Technology Research, other guests on theCUBE and guest writers. Such statements are not recommendations by these individuals to buy, sell or hold any security. The content presented does not constitute investment advice and should not be used as the basis for any investment decision. You and only you are responsible for your investment decisions.
Disclosure: Many of the companies cited in Breaking Analysis are sponsors of theCUBE and/or clients of Wikibon. None of these firms or other companies have any editorial control over or advanced viewing of what’s published in Breaking Analysis.
Support our mission to keep content open and free by engaging with theCUBE community. Join theCUBE’s Alumni Trust Network, where technology leaders connect, share intelligence and create opportunities.
Founded by tech visionaries John Furrier and Dave Vellante, SiliconANGLE Media has built a dynamic ecosystem of industry-leading digital media brands that reach 15+ million elite tech professionals. Our new proprietary theCUBE AI Video Cloud is breaking ground in audience interaction, leveraging theCUBEai.com neural network to help technology companies make data-driven decisions and stay at the forefront of industry conversations.