

 CLOUD
CLOUD
CLOUD
CLOUD
CLOUD
Microsoft Corp. last week delivered what looks on paper like a great quarter, with a beat of 1% and 5% on revenue and operating operating profit, respectively. But the two-day reaction from investors tells a different story, with the stock off double digits from its pre-earnings price.
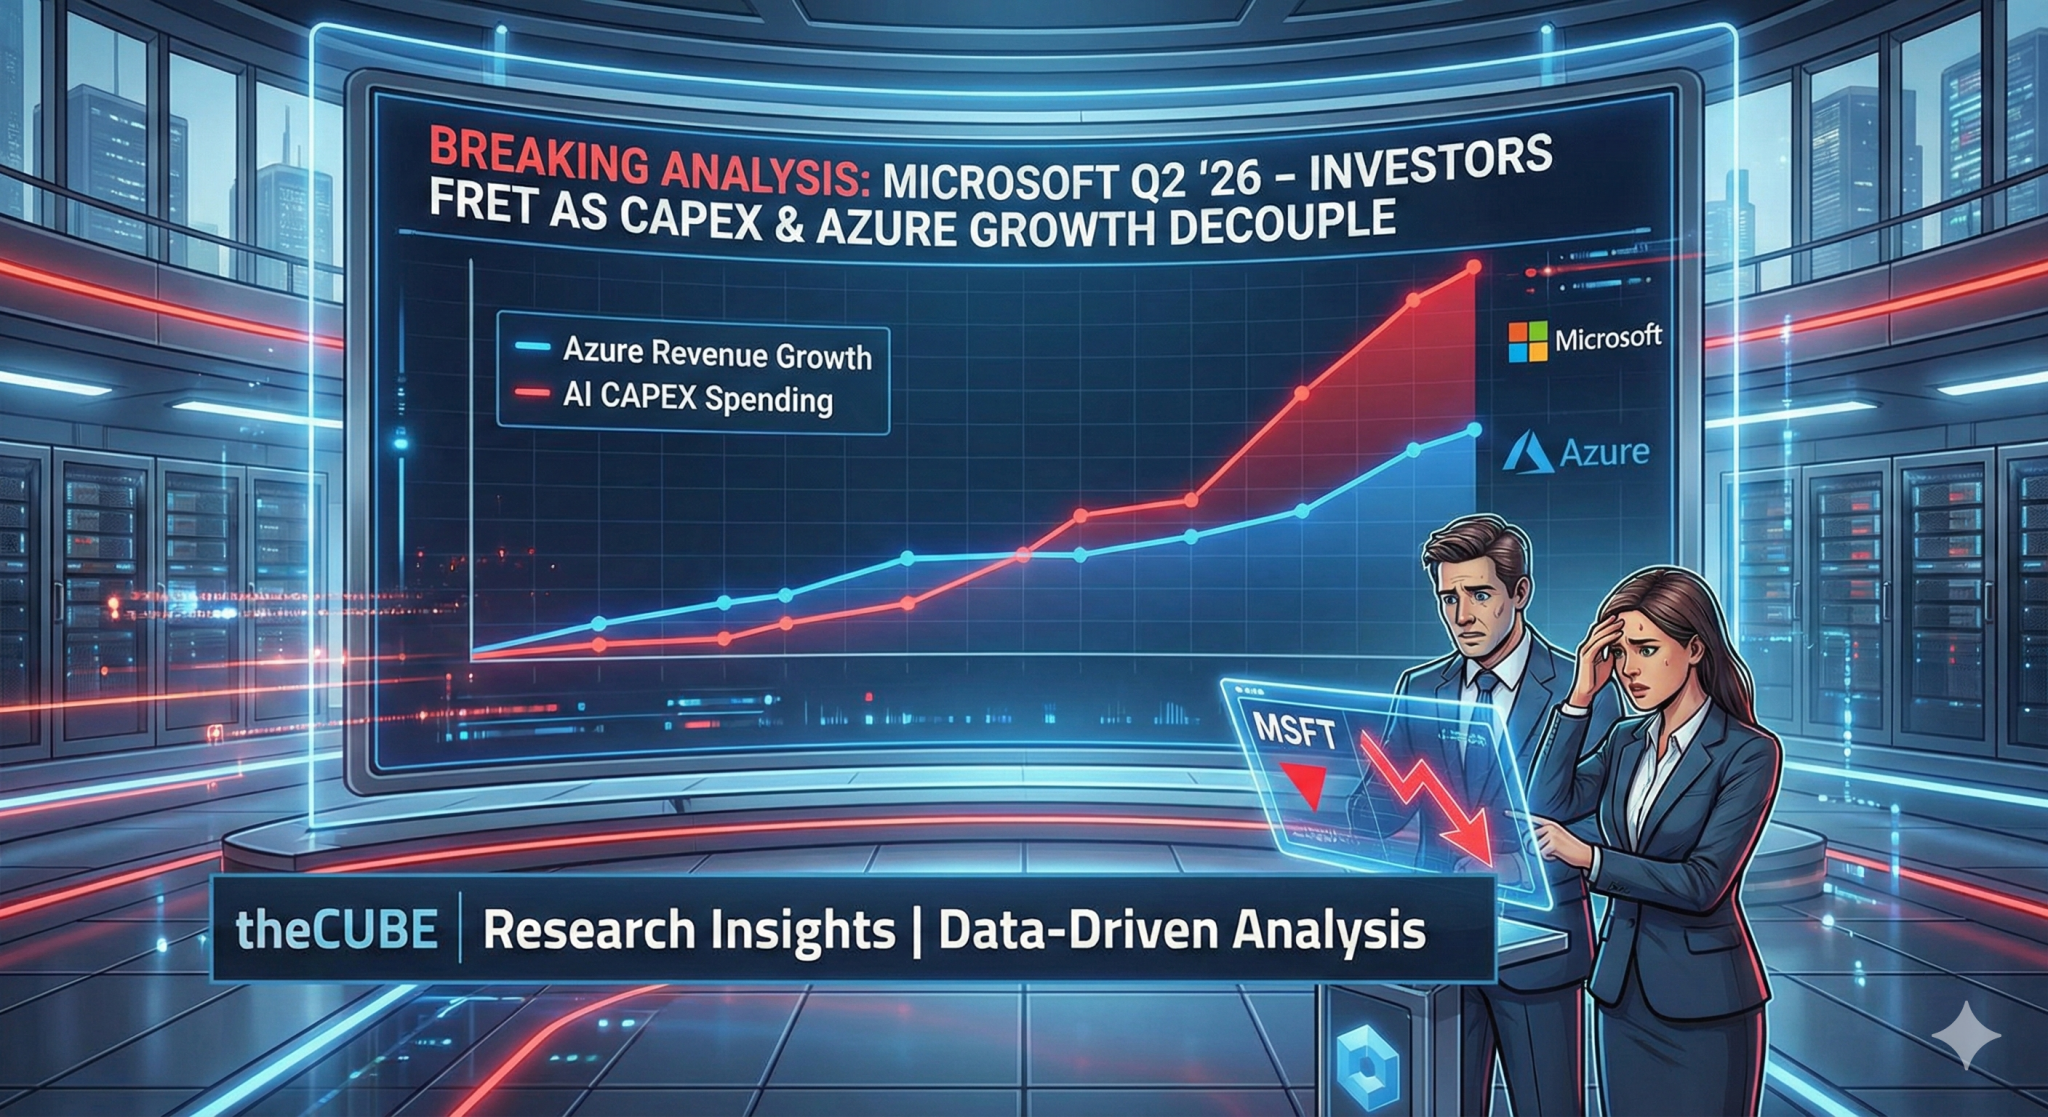
Last quarter, increased capital spending was interpreted as a signal for enthusiasm and confidence. But artificial intelligence ambition has turned into AI skepticism. Specifically, Microsoft’s capital expenditures came in higher than expected but Azure growth didn’t. Without a clean bridge from capital spend to clear cloud return on investment, Azure growth, despite an impressive performance, has become a sticking point.
In this Breaking Analysis, we unpack nuggets from Microsoft’s second-quarter 2026 earnings print and explain why in our view, the Street’s negative reaction misses the bigger picture.
The chart below shows Microsoft’s stock over the past five trading days. After the earnings announcement on Wednesday, the stock took a hit, falling after the market close. It was down Thursday and kept sliding on Friday. In the top right, you’ve got a confident Meta Platforms Inc. Chief Executive Zuckerberg and a frowning Microsoft CEO Satya Nadella. Meta crushed its quarter, and the market clearly thinks it’s getting a lot of bang for its buck with AI investments. Microsoft? Not so much, according to the market’s reaction.
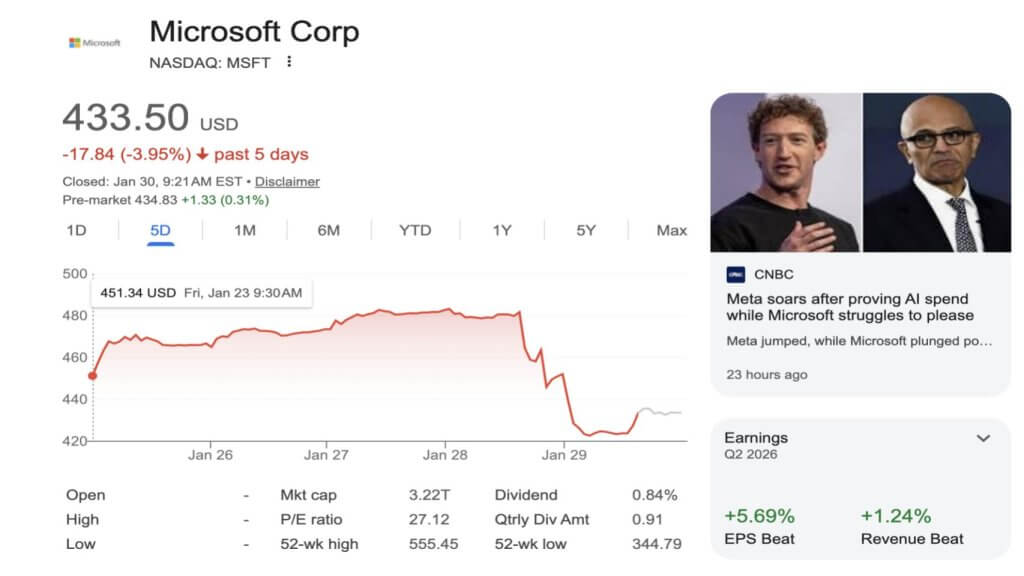
The market seems confused, as you can see above the stock was in the green pre-market for a brief period of time, then ended down for the day, with the stock off 11% since the earnings print. The confusion comes from investors’ hope that CapEx and Azure growth would move in smooth, lockstep pattern; but that rarely happens and the divergence is not surprising, as we’ll explain in more detail below.
In our view, Satya Nadella’s remarks are best understood as a shift in what Microsoft wants investors to measure. The company’s cloud business is enormous – using simple math, it is running at roughly a $200 billion run rate across Azure and the broader software-as-a-service portfolio – but the emphasis is moving toward building token factories and distributing that capability across a expanding edge and distributed cloud estates.
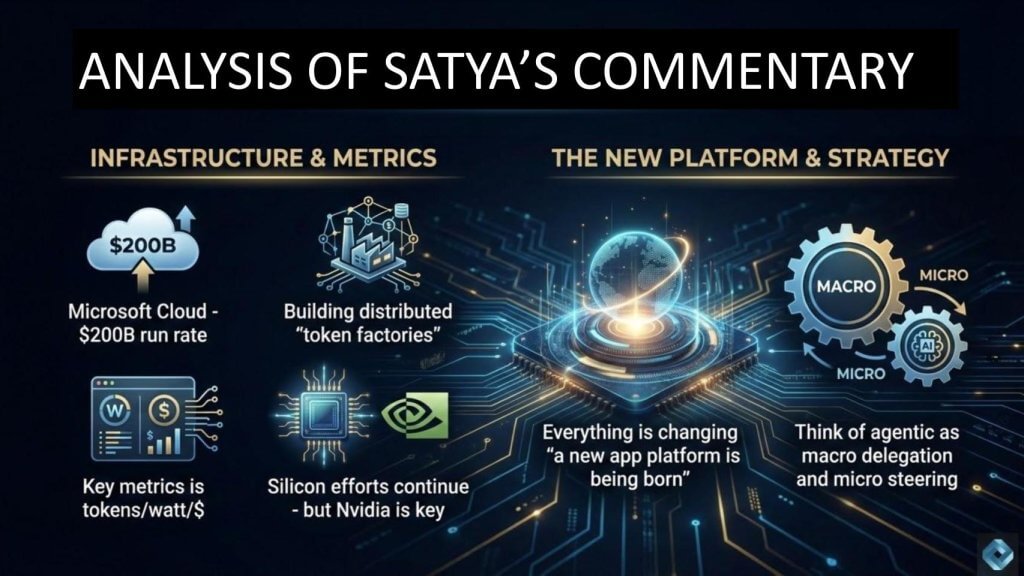
Nadella referenced “token factories,” and cited the most important metric “tokens per watt per dollar.” We believe Microsoft is confirming our premise that AI infrastructure economics are becoming the governing key performance indicator. The winners are the ones that improve performance and throughput while lowering cost, because that is what expands adoption and usage.
That is why our analysis naturally connects to Nvidia Corp.’s recent CES disclosures around Vera Rubin – 5X performance, 10X throughput and one-10th the cost per token. In our view, this reinforces the flywheel that we believe drives a 15X demand expansion through Jevons Paradox. This is a key reason Nvidia separates from the broader graphics processing unit pack, even as hyperscalers invest in their own silicon.
Microsoft referenced Maia and Cobalt, highlighted work with Advanced Micro Devices Inc., and positioned its silicon program as part of the optimization path. Nadella later cited improvements in tokens per watt per dollar tied to OpenAI Group PBC inference, and we believe that is relevant because access and allocation to the most efficient hardware becomes critical. Nvidia remains the most critical supplier to all AI leaders and Nadella doesn’t have the supply he needs to satisfy all his demands. As such, Microsoft must balance GPU allocation between lower margin Azure AI services (for example, OpenAI inference) and first-party AI (for example, M365 and GitHub Copilot).
Our expectation is that “tokens per watt per dollar” will continue to show up across the hyperscalers. Google LLC and Amazon Web Services Inc. are running in the same race, and Microsoft’s language suggests the industry is converging on a common set of economics-driven metrics that connect CapEx to outcomes. The rub in the quarter is the CapEx and Azure growth diverged.
The second major takeaway from the earnings call is the application platform transition. Nadella said a new application platform is being born, and we agree. We believe the shift from on-prem to SaaS changed everything – technical architectures, operating models and pricing. We expect another full-stack shift as AI becomes the dominant interface and execution layer. Seat-based pricing is becoming less aligned with value as tokens and outcomes become the important variable. Consumption models already pulled software in this direction. Outcome-based pricing is the next step as enterprises price to delivered results, with token usage serving as the underlying cost that has to be managed.
Finally, Nadella’s comments on agentic initiatives give insight to how Microsoft thinks about future software architectures. He describes agentic systems as “macro delegation and micro steering.” This is Microsoft’s way of separating orchestration from execution. We believe this maps cleanly to an orchestration layer coordinating agents that do focused “worker bee” tasks. The company is investing to refactor its stack around that model, and the resources being applied indicate Microsoft views this as a platform transition, not a set of new features.
We believe Nadella is telling the market that Microsoft is building the infrastructure and platform layer for the token economy, with tokens per watt per dollar as the core KPI, Nvidia-driven efficiency improvements will shape unit economics, and an emerging application platform that shifts software monetization toward outcomes as orchestration and agentic execution become the key building blocks.
In our view, the most important part of Chief Financial Officer Amy Hood’s commentary is the tension between scale performance and the margin and growth tradeoffs created by AI infrastructure. Microsoft is operating at an astounding $325 billion revenue run rate, growing the top line about 15% in constant currency. Earnings growth is also strong at roughly 21% in constant currency. Those are extraordinary results for a $300 billion-plus company. But the market reaction suggests the sentiment has moved from “How strong is Microsoft?” to “How fast does AI infrastructure convert into monetization, and at what margin?”
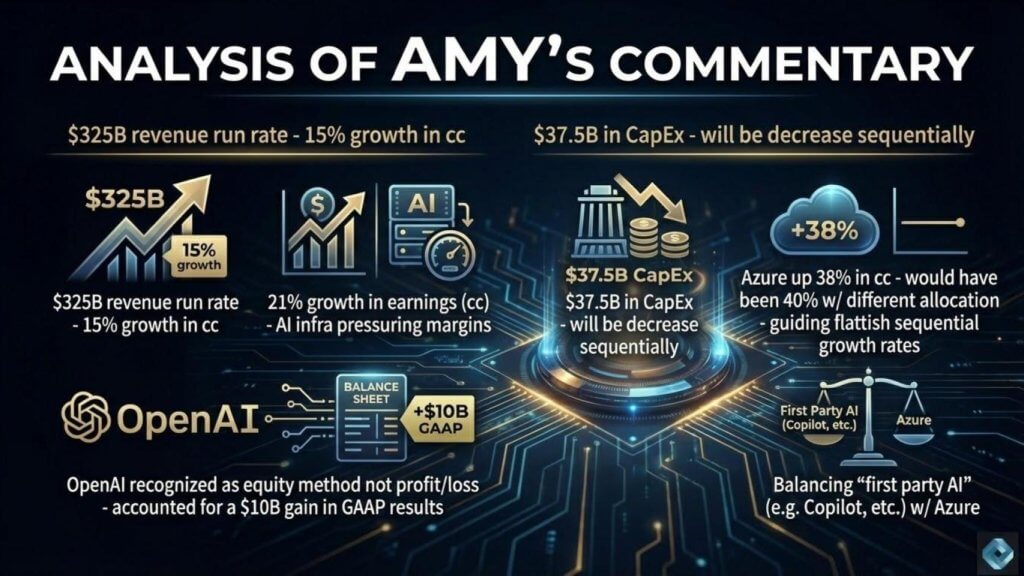
The key issue to consider is margin pressure. Microsoft’s historical software economics at scale were defined by near-zero incremental cost. In the CD-ROM era, the marginal cost at volume was essentially the media – literally pennies. Cloud shifted that as SaaS delivery introduced a real cost structure driven by compute, storage and networking cost of goods sold. AI further pressures margins because the economics now include a heavy AI infrastructure layer, with GPUs and central processing units driving cost of goods and capital intensity. This is a structural change that forces investors to rethink what “software margins” mean in an AI-first operating model.
CapEx is the real story. Microsoft spent $37.5 billion in CapEx in the quarter. That number dominated the discussion because it shines a light on the conversion cycle from investment to revenue and profit. Azure grew 38% in constant currency, which is strong in absolute terms, but it came in below the 40% expectation many investors had anchored to. The company guided to flattish sequential growth rates for Azure, and that fed the narrative that CapEx and Azure growth are decoupling.
The second issue is allocation. Microsoft has to decide how much GPU capacity goes to Azure services versus first-party services and products such as Copilot, including coding use cases. Management said that without the need to balance capacity across Azure and first-party AI, Azure growth would have been 40%. We believe that comment was intended to explain the constraint, but the market interpreted it as a negative signal about the near-term ability to translate CapEx into cloud growth. What the market looked past was Microsoft’s guidance that CapEx growth would decline sequentially while Azure growth will maintain its current trajectory.
A side point worth noting is how OpenAI flows through the financials. Microsoft’s ownership in OpenAI is recognized as equity rather than profit and loss, so the reported impact reflects OpenAI’s balance sheet performance. That contributed to a $10 billion gain in GAAP or net results on the income statement, but it does not change the core operating question investors are asking about ongoing monetization and margins.
Stepping back, we believe the market is demanding more clarity on the conversion timeline from CapEx spend to Azure revenue and profit specifically. Investors want the relationship between AI infrastructure buildout and revenue growth to feel immediate and in lockstep. In our view, that expectation is unrealistic. Infrastructure buildout takes time, and the monetization path depends on productizing that capacity into APIs, inference services, and application-level intelligence. Microsoft also emphasized model optionality, which aligns with a broader hyperscaler playbook, but optionality does not shorten the time required to deploy capacity, integrate it and drive consumption.
We believe the quarter highlighted a an operating reality that Microsoft is delivering exceptional scale growth while absorbing AI infrastructure costs, and the market is focused on how quickly CapEx converts into Azure and application monetization. The demand is there, but the core issue is the pace of deployment, the allocation of scarce GPU capacity, and the timeline investors are willing to tolerate as Microsoft builds its token factories and turns it into durable revenue.
The sell-side analysts’ main concerns related to the CapEx rising faster while Azure growth is moderating, and investors want better visibility into the ROI path. Keith Weiss of Morgan Stanley pressed that point, focusing on the relationship among capacity buildout, Azure growth and the timeline for returns. The market’s reaction suggests this is the central issue, despite the headline revenue and earnings performance.
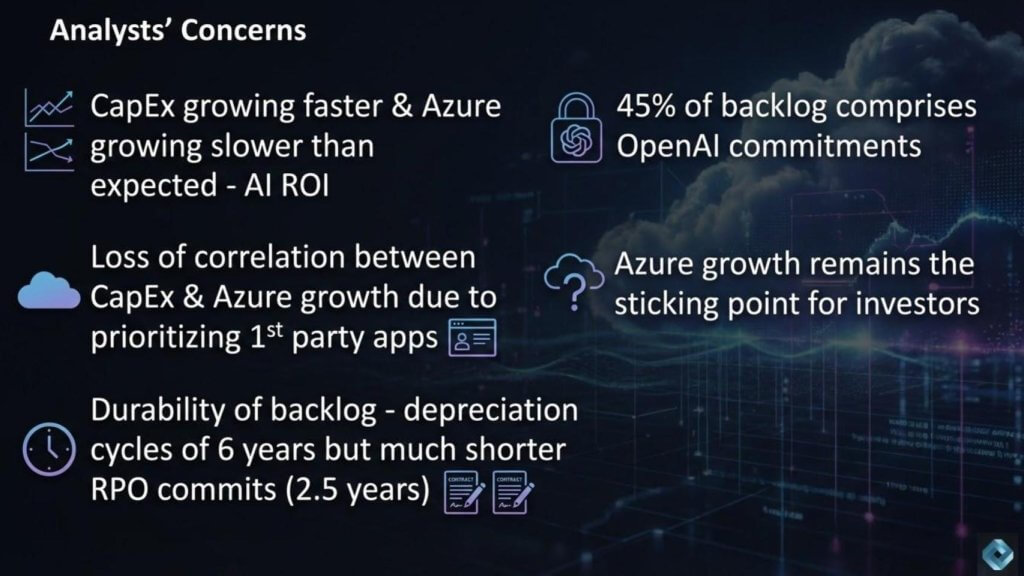
The decoupling between CapEx and Azure growth is a product of prioritization. Microsoft is allocating scarce AI capacity across two competing objectives: 1) Expanding Azure’s AI services; and 2) Building out first-party experiences such as Copilot. We believe this tradeoff makes economic sense. Azure carries lower gross margins relative to Microsoft’s first-party software products, and first-party AI features are the way Microsoft protects and extends its software franchises. In this context, the allocation decision is a margin optimization as well as a product strategy.
This also highlights product quality and execution. Copilot has received mixed reviews from customers. Offerings from AI specialists such as Glean Technologies Inc. are in many ways what Copilot should be delivering. We believe Microsoft well understands the gap. The company has a long history of shipping a rougher 1.0 and improving it through iteration, distribution and sustained investment. We expect Copilot to follow that pattern. The near-term consequence is that the market gets a less predictable story on the CapEx-to-Azure-growth relationship because some of the capacity is being directed toward first-party adoption and learning curves.
The second concern is backlog. Analysts pointed to the mismatch between infrastructure depreciation cycles and revenue visibility. Analysts referenced GPU and CPU depreciation cycles that Microsoft uses of roughly six years, while remaining performance obligations or RPOs sit at about 2.5 years. That is an improvement from roughly two years last quarter, but it is still materially shorter than the asset life. This creates a natural investor concerns over how durable the backlog is relative to the capital being deployed.
The OpenAI exposure is an additional concern. About 45% of the RPO is tied to OpenAI commitments. Microsoft’s response referenced visibility and demand dynamics saying about 25% of backlog is expected to convert within the current fiscal year. Meanwhile the backlog is expected to grow, and demand continues to outstrip supply. We believe management was trying to reinforce confidence in near-term conversion. Investors, however, are focused on what happens beyond the current horizon, especially when depreciation assumptions are longer than the contracted visibility window. Moreover, if and when the bubble bursts, so will demand and with it the backlog.
All of that brings the discussion back to Azure growth as the sticking point. The market is willing to fund CapEx if it sees a credible path to sustainable monetization at scale. When Azure growth underwhelms expectations, the ROI debate becomes louder and scrutiny intensifies.
Nonetheless, we believe Microsoft is making a rational allocation choice to maximize long-term margin and platform leverage, but the market is demanding better visibility on how CapEx converts into Azure growth and sustainable backlog. Azure growth remains the key factor, and the combination of shorter RPO visibility, meaningful OpenAI exposure and long asset lives keeps ROI and backlog visibility at the center of the conversation.
Let’s take a look at some external data that validates Microsoft’s position. Below we show Microsoft’s account-based spending momentum from Enterprise Technology Research data. The market is debating CapEx, Azure growth rates and AI ROI timing. This data helps separate near-term sentiment from what customers are actually planning to do with Microsoft across the portfolio.
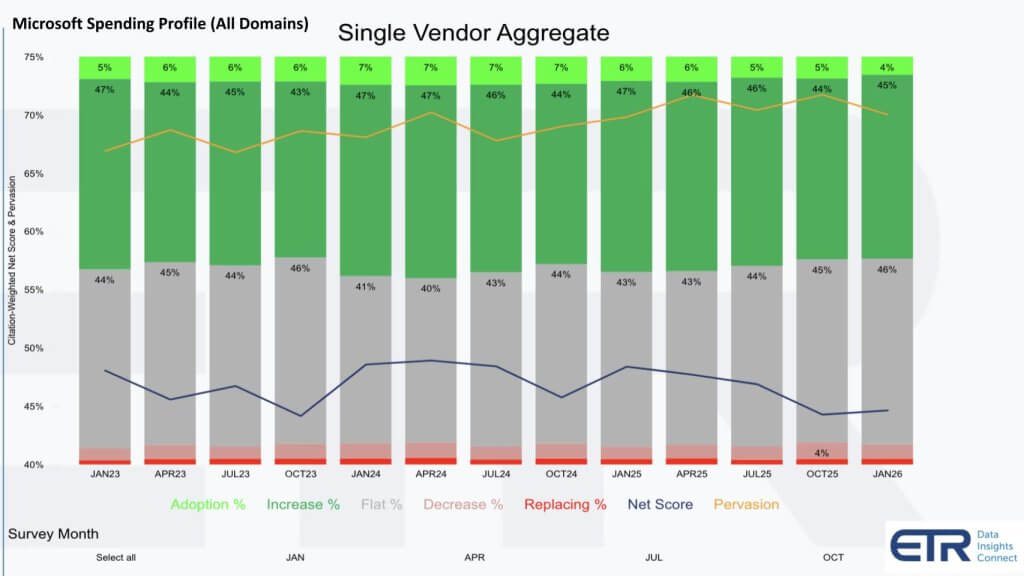
This chart above uses ETR’s proprietary Net Score methodology, which measures spending intention and velocity across roughly 1,700 enterprise accounts, with Microsoft represented in well over 1,000 of them. The stacked bars go back to January 2023 and break the installed base into spend behavior segments.
The blue Net Score line is derived by subtracting the reds from the greens. It has been hovering in the mid-40s. In this framework, anything above 40% is considered highly elevated. We believe the key point is Microsoft is sustaining highly elevated spending momentum while operating at a $300 billion-plus scale. That combination is rare and speaks to ubiquity and outstanding execution.
The yellow line at the top represents pervasion, or penetration, into the 1,700-account dataset. It sits around the 70% level with minimal variability. We do not view the small dips as meaningful. Microsoft’s footprint is extensive and sustainable, and that market presence creates the conditions for platform adoption.
We believe Microsoft is increasingly benefiting from data gravity. The company is not just an infrastructure and productivity vendor. It is becoming a data platform player as well. Fabric was referenced as one of Microsoft’s fastest-growing products in its history, and in our view it strengthens the gravitational pull by bringing together data and analytics inside Microsoft’s ecosystem.
When the data and the platform sit in the same footprint, it becomes easier to attach ancillary products and drive adoption of AI-infused experiences, including Copilot for Microsoft 365, GitHub-related offerings and other first-party workloads. Where Microsoft’s first-party data products are insufficient, its ecosystem partners such as Databricks Inc., Snowflake Inc. and a spate of other ecosystem partners fill the gaps.
We also believe Microsoft’s product cycle maturity is relevant here. Early versions are not always great, but the company tends to iterate aggressively, learn from deployment, and eventually get products into a mature state. We’ve seen that dynamic play out with Power BI, Power Automate and many other products in the portfolio. In our opinion, that trend underpins why spending momentum stays elevated over time, even when the market debates the short-term narrative.
It’s just easy and convenient to do business with Microsoft.
We believe ETR’s Net Score and pervasion view reinforces our belief that Microsoft’s customer momentum remains exceptionally strong at massive scale, and that the company’s expanding data platform installed base increases the pull for AI products, even as investors debate near-term CapEx, Azure growth and the pacing of AI ROI.
We believe the cloud leaders continue to lead and the cloud is where most AI services are being consumed. ETR’s cloud sector analysis makes that obvious. This chart below plots spending momentum against account overlap across 1,746 enterprise accounts and covers the full cloud computing sector, not just infrastructure as a service and platform as a service. The data suggests the hyperscalers remain in a power position, and the emergence of AI-native infrastructure providers inside the survey shows at where the next layer of cloud demand is forming.
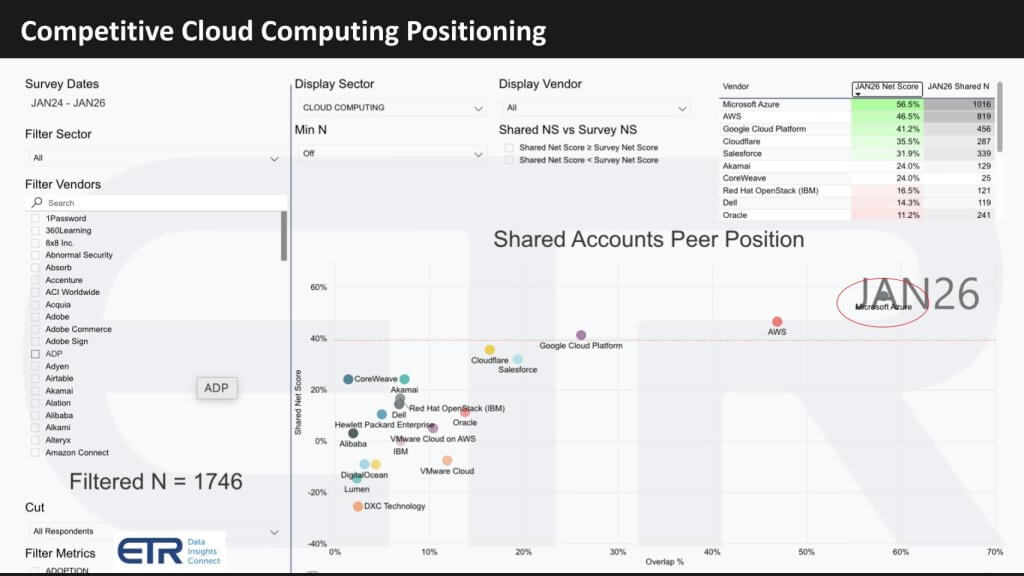
The vertical axis is Net Score, ETR’s measure of spending momentum. The horizontal axis is overlap, a proxy for penetration across the 1,746 accounts. The red dotted line at 40% is the highly elevated momentum line.
Microsoft sits in the upper right, with both high penetration and highly elevated momentum, and AWS is also positioned as a leader separating from the rest of the field. Google Cloud Platform is above the 40% line as well and is tightening the gap on the top two thans to its AI and data chops. All three hyperscalers are operating above the “highly elevated” threshold, which reinforces the idea that enterprise cloud demand remains structurally strong.
Below the hyperscalers, the chart shows a mid-pack where providers have meaningful presence on the horizontal axis but less momentum. Oracle Corp. stands out here. It has relatively strong penetration on the horizontal axis, sitting just behind Cloudflare Inc. and Salesforce Inc., which sell higher-volume products. Oracle’s presence reflects a different model with fewer, larger deals and higher value and price points. IBM Corp. appears in the same mid-pack cohort. We believe this supports the broader point where cloud adoption continues to outpace on-premises data centers, and even vendors with different go-to-market models retain meaningful footprint as enterprise architectures modernize.
We also see evidence that the rich get richer. Microsoft’s hybrid and on-prem business grew in the low single digits, roughly 1% to 2%, while its overall cloud business grew in the mid-20s and Azure approached 40% growth. In our view, this persists as enterprises continue reallocating budgets toward cloud services that deliver velocity, elasticity, and increasingly AI infrastructure.
One of the more interesting developments is on the far left with CoreWeave Inc. appears in the dataset. Its Net Score is not off the charts, but the fact that it shows up at all is relevant because CoreWeave historically sells heavily into AI specialists and model builders. We believe this is an early indicator that AI infrastructure specialists are expanding their enterprise footprint. We are watching CoreWeave alongside Lambda and Crusoe, which are increasingly central to building and operating the AI infrastructure layer.
That AI infrastructure layer has long-term budget implications. We have said repeatedly that information technology spending averages around 4% of revenue as a rule of thumb. We believe that over the next five to seven years, that figure moves toward 10% of revenue or more, driven by AI infrastructure and token-driven services. The directional shift is away from legacy IT stacks and toward token generation and consumption through APIs. In our opinion, the hyperscalers are best positioned to monetize this shift because they own the cloud delivery platform and are building the token factory layer on top of it.
We believe the ETR cloud sector view reinforces that hyperscalers remain in an advantageous position, cloud continues to outpace on-prem, and AI-native infrastructure providers are beginning to surface in enterprise datasets as the token economy expands. Over time, token API services become a core driver of productivity and workflow redesign, and the cloud leaders are positioned to capture that shift.
Let’s step back and look at IaaS and PaaS share over time. The view below isolates the core cloud infrastructure market – it excludes Microsoft 365 and other SaaS products – and shows how AWS, Azure, GCP, Alibaba and Oracle have been performing since 2020. The market is large, still growing quickly, and the share shifts help explain why investors are so sensitive to any hint that AI CapEx is not translating into near-term growth.
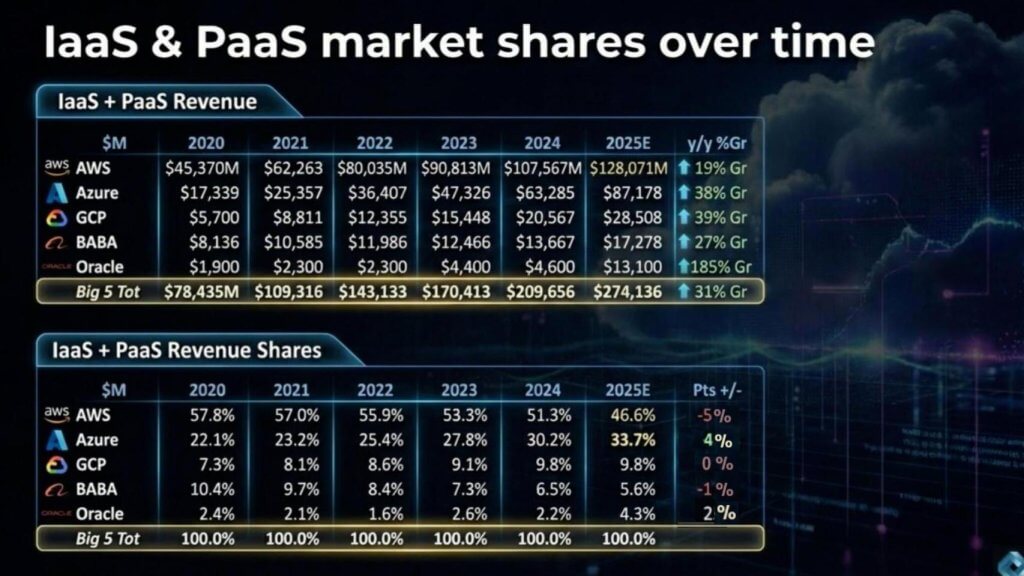
The top half of the slide shows IaaS and PaaS revenue by provider, with 2025 as an estimate. The “Big 5” expands from roughly $78.4 billion in 2020 to an estimated $274.1 billion in 2025, a 31% year-over-year growth rate for the cohort.
Within that growth, the mix is changing:
The bottom half shows how those growth rates translate into share shifts from 2024. AWS declines from about 51.3% in 2024 to 46.6% in 2025E, a five-point drop inside this cohort. Azure rises from about 30.2% to 33.7%, a four-point gain. GCP holds roughly 9.8%. Alibaba declines about one point to 5.6%. Oracle rises from roughly 2.2% to 4.3%, a two-point gain.
The longer view is the real story. AWS moves from roughly 57.8% share in 2020 to 46.6% in 2025E, while Azure rises from roughly 22.1% to 33.7%. GCP improves through the early years and then holds share as Azure accelerates and the cohort mix changes. Oracle’s share gain looks modest relative to its growth rate because the market itself is large and growing fast.
We believe this share math helps explain the current market psychology. Valuations are high, CapEx is rising and investors want the ROI timeline to be shorter and more visible. That creates a knee-jerk reaction when growth shows slightly below expectations, even if the market position remains strong. In our view, the underlying cloud market continues to expand, and the share shifts show that the winners keep compounding, even as the leaderboard evolves.
We believe the share data reinforces two truths that cloud demand remains strong and is still growing fast, while the market is repricing leadership based on who converts AI-era investment into the next leg of growth. AWS remains the scale leader, Azure continues to take share at a meaningful clip, GCP is increasingly viable and accelerating, and Oracle’s growth rate is too large to ignore. Against that backdrop, we believe investors are prone to overreacting to near-term variance because the AI ROI cycle is entering a phase where expectations are high and patience is thin.
Longer-term, we believe Microsoft is making the investments that will set it up for massive valuations in the coming decade.
Support our mission to keep content open and free by engaging with theCUBE community. Join theCUBE’s Alumni Trust Network, where technology leaders connect, share intelligence and create opportunities.
Founded by tech visionaries John Furrier and Dave Vellante, SiliconANGLE Media has built a dynamic ecosystem of industry-leading digital media brands that reach 15+ million elite tech professionals. Our new proprietary theCUBE AI Video Cloud is breaking ground in audience interaction, leveraging theCUBEai.com neural network to help technology companies make data-driven decisions and stay at the forefront of industry conversations.