 NEWS
NEWS
NEWS
NEWS





NEWS

Tableau Software Inc. is looking to broaden its horizons and bring Big Data to the masses with a new product for iOS devices that lets anyone dig into their data and visualize what they’re doing right or wrong.
The opportunity is certainly there – while Big Data has become massive in the enterprise, the wider public at large has little understanding of the concept, and what data analysis could do to improve their lives.
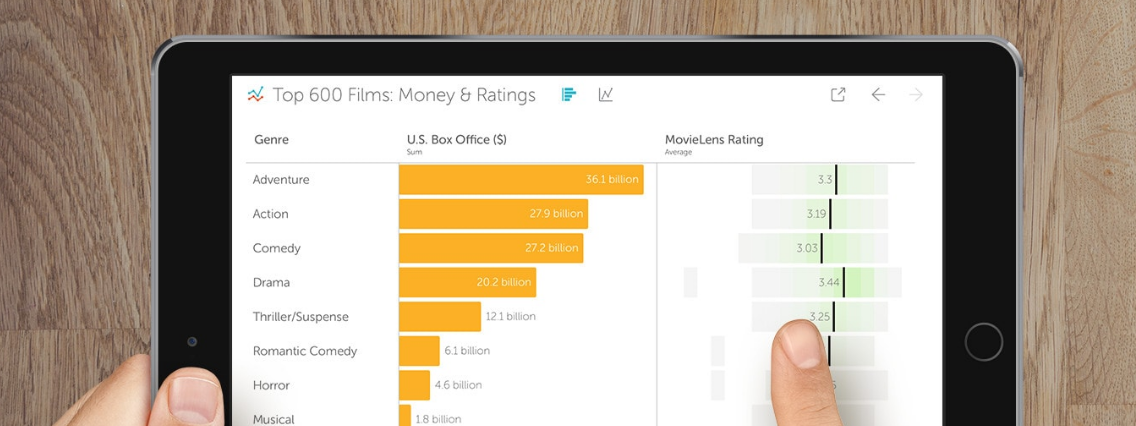
Called Tableau Vizable, the new iPad app was demoed yesterday at the Tableau user conference in Las Vegas. Free to download, the app can handle data in popular formats like CSV and Excel, allowing users to dig into it by dragging, pinching and swiping various items. The app is Tableau’s second free offering, after releasing the Tableau Public platform on Windows and Mac.
“We realized that if we were going to start Tableau over again today, for the mobile generation, we’d build it for touch and on a mobile device,” Story explained when showing me the app.
In a private demo, Tableau’s vice president of mobile and strategic growth Dave Story told me Vizable was designed to make Big Data more accessible to the average Joe, although he said the app would be useful for business executives as well. Tableau Vizable fills an important gap in the iPad’s ecosystem, Story explained, because there’s simply nothing else available in the app store that lets people visualize their data.
As Story walked me through a few sample data sets, it became clear that the possible use cases for an app like Vizable are virtually limitless. Personal finances, fitness data from something like the Nike Band, Amazon shopping habits are just some of the things that can be visualized. Story asked me to provide my own data, and I dutifully passed over a spreasheet containing all of my bets on soccer games over the previous two months. Now, I’m a pretty poor gambler, most likely because I make impulsive bets every single day on a variety of national leagues and competitions. But within seconds of feeding my data into Vizable, I found to my complete surprise that had I stuck to betting on only the Argentinean and Brazilian soccer leagues, I’d have made a tidy profit over the last two months instead of being almost $200 down.
There are some limitations to Vizable, such as not being able to filter on a value range. The variety of visualizations doesn’t compare with Tableau’s full software suite either, but even so there’s more than enough here to get people’s attention and show them how their data can be used to benefit them.
Tableau Vizable is initially available for the iPad only, though Story said an Android version will be released at a later date.