Earnings prints from the likes of Dell Technologies Inc., Super Micro Computer Inc. and more recently Hewlett Packard Enterprise Co. have shown the artificial intelligence server trend is not just benefiting cloud hyperscalers but also firms with large on-premises installed bases.
Oracle Corp. as well is trading at an all-time high, citing cloud momentum and recent deals with Google LLC, OpenAI and prior deals with Microsoft Corp. But make no mistake, the momentum from the big three U.S. hyperscalers remains impressive, especially when considering the size of these firms.
Combined, infrastructure-as-a-service and platform-as-a-service infrastructure revenue for Amazon Web Services Inc., Microsoft Azure and Google Cloud Platform will approach $195 billion this year. Add in Alibaba Group Holding Ltd. and the market will exceed $200 billion and is growing above 20% annually. One notable callout however is Supermicro, which is growing in the triple digits and has put itself directly into the AI server mix.
In this Breaking Analysis and ahead of HPE Discover, we update you on the action in the on-premises and cloud infrastructure markets as AI servers power an AI trade that is extending beyond the four silicon horsemen of Nvidia Corp., Taiwan Semiconductor Manufacturing Corp., Broadcom Inc. and Qualcomm Inc. We also share some recent Enterprise Technology Research spending data and dig deeper into the true size of Microsoft’s Azure IaaS and PaaS revenue.
AI servers and powering the on-prem legacy
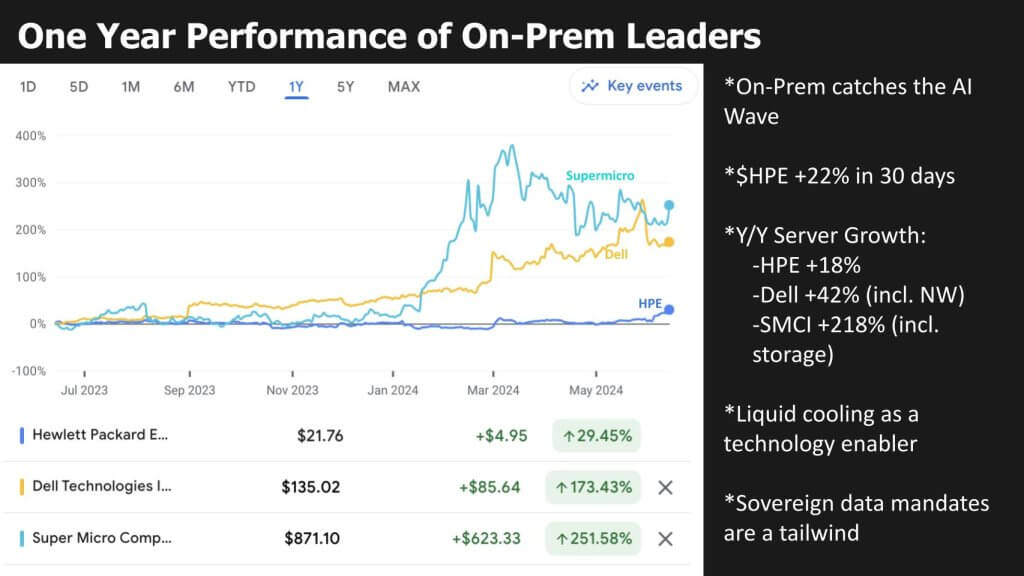
Let’s start by looking at the market performance of three bellwether on-premises server market leaders – Supermicro, Dell and HPE.
Above we show a 12-month view of the performance of these stocks. Over the past year, they’ve experienced significant gains, reflecting an increased demand for AI servers and related technologies.
Key points
HPE performance:
Up 22% in the last 30 days.
One-year growth: ~30%.
Last quarter server growth: 18%.
Dell Technologies performance:
One-year growth: 173%.
Last quarter server growth: 42% (includes some networking).
Experienced a significant stock drop due to profit declines despite exceptional server revenue growth.
Focused on large deals with managed service providers, aiming for margin improvement as it sells more to enterprises.
Positioning for future opportunities with additional products and services.
Supermicro performance:
One-year growth: 251%.
Last quarter growth: 218% (includes storage).
Market dynamics:
AI server wave significantly benefiting HPE, Dell and Supermicro.
Liquid cooling is a key enabler. HPE is marketing it as a differentiator, with significant investments in this technology and strong positioning in liquid cooling with Cray assets.
Sovereign data requirements driving demand for on-premises AI servers as governments seek to keep data within their borders.
The year-on-year server growth for HPE, Dell and Supermicro underscores a meaningful expansion driven by the AI wave. While Dell faces margin concerns, it is strategically positioning itself for future profitability by securing account footprint into which it will sell storage infrastructure, PCs and other services. Supermicro’s exceptional growth, focus on packaging flexibility and cost effectiveness highlight its competitive edge. The demand for sovereign data solutions further strengthens the on-premises server market, making these companies well-positioned for continued success. Each has expressed strong demand and good visibility for the next several quarters.
Focus on HPE server spending patterns
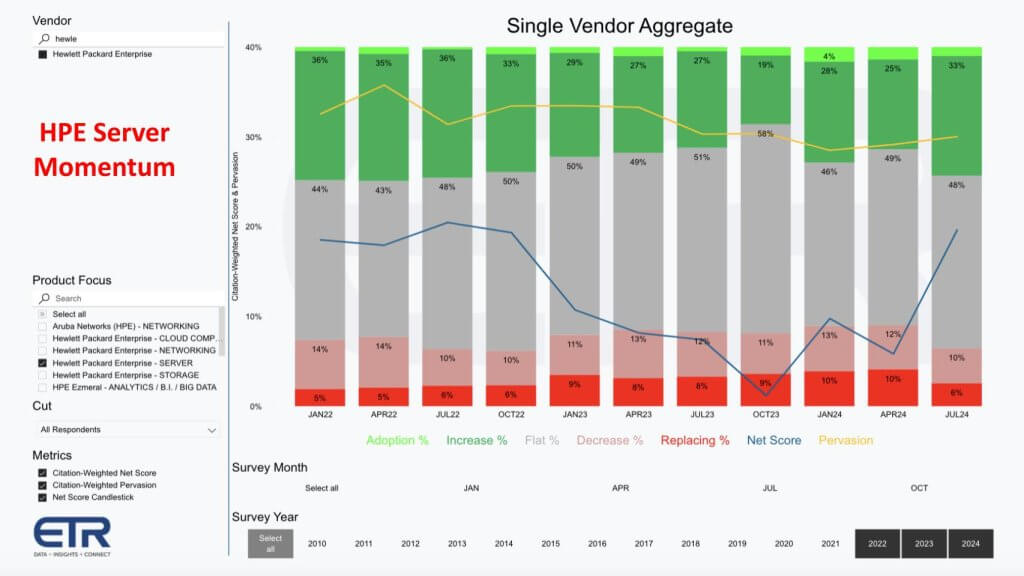
HPE’s strong recent quarter is reflected in the ETR data shown below.
The graphic above breaks down ETR’s proprietary Net Score methodology and provides a detailed analysis of spending patterns for HPE servers (N~120). The methodology is focused on customer/account penetration and doesn’t reflect dollar amounts.
Specifically breaking down the bars shown above:
New logo adoption
The lime green section represents new logos, i.e. the percentage of new customers adopting HPE servers. As you can see, this is relatively small.
Increased spending:
Forest green section shows that 33% of the customers in the survey are increasing spending by more than 6% on HPE servers.
Stable spending:
Gray section (48%) is the largest category, representing customers spending within ±5%.
Decreased spending:
Pink section indicates a decline in customers spending less on HPE servers (decrease of 6% or more).
Containment/churn:
Bright red section indicates customers putting HPE servers in containment or churning off the platforms, which has decreased, indicating a positive trend.
Net Score:
Net score is derived by subtracting the reds from the greens, represented by the blue line, showing an upward trend and momentum for HPE servers.
Market penetration:
The yellow line represents market penetration or share within the dataset, providing insight into HPE’s market presence.
The ETR data aligns with the positive trends in the market and showcases HPE’s robust performance. The positive trend in Net Score, increase in those customers spending more and reduced churn all indicate strong momentum for HPE servers. Market penetration as well appears to be slowly improving, reflecting HPE’s continued influence in the on-premises server market.
Comparing on-prem and hyperscaler business performance
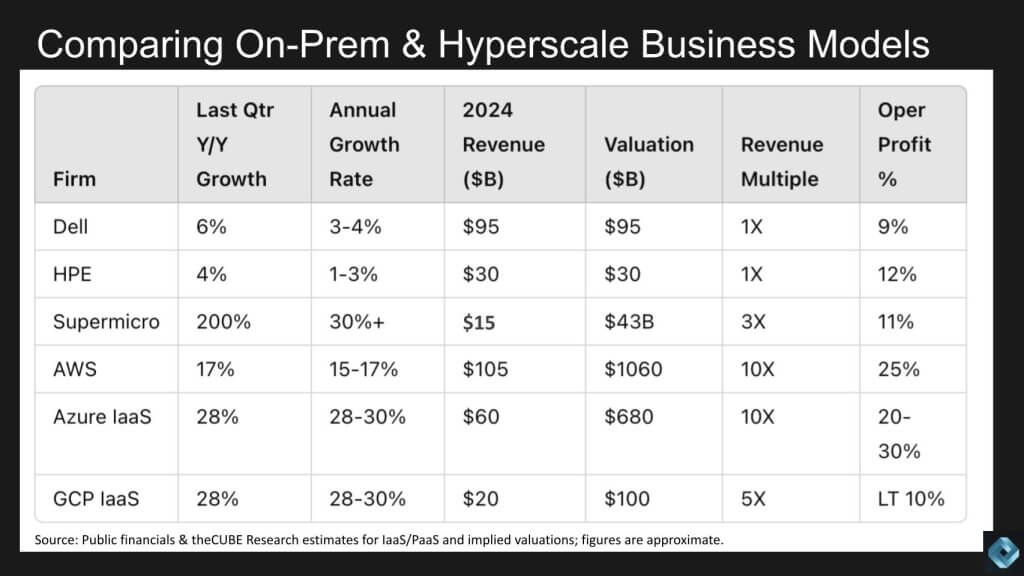
Though the on-premises server market shows strength, we find it instructive to compare these firms with hyperscalers to gain a more comprehensive view of the market. The following analysis compares the recent quarterly data for Dell, HPE, Supermicro, AWS, Microsoft Azure and GCP to provide a benchmark, highlighting their growth rates, revenue projections, valuations and operating profits.
The data above was compiled using a combination of publicly available financial data, theCUBE Research market modeling and inferred valuations based on reasonably educated estimates. The data are approximate and intended to be used for rough comparative purposes.
Dell Technologies:
Last quarter revenue growth: 6%.
Annual growth rate: Low to mid-single digits.
2024 Revenue forecast: $95 billion.
Valuation: $95 billion (1x revenue multiple). It wasn’t long ago that Dell was trading at less than 50 cents on the revenue dollar.
Operating profit: 9%. Dell remains a relatively low-margin hardware business with high volume, excellent supply chain discipline and liquidity that allows it to return substantial portions of its free cash flow back to investors.
Recent focus: Cleaning up balance sheet, aligning product portfolio and momentum from is Nvidia partnership (Dell AI Factory) have significantly increased its valuation, despite recent concerns over the profitability of AI servers.
HPE:
Last quarter revenue growth: 4% (40%+ server growth).
Annual growth rate: 1% to 3%. We believe this reflects management conservatism and, with graphics processing unit backlogs reducing to under 10 weeks, HPE could have some upside potential.
2024 Revenue forecast: ~$30 billion.
Valuation: ~$30 billion (1x revenue multiple).
Operating profit: Low double digits and higher than Dell due to absence of PC sales and focus on server, storage and networking margins.
Note: Conservative growth projections with potential acceleration due to AI server backlogs shrinking.
Supermicro:
Last quarter growth: 200%.
Future growth rate: 30%+.
Revenue forecast: $15 billion.
Valuation: $43 billion (3x revenue multiple).
Supermicro at $15 billion and a 100%+ annual growth rate is remarkable. Our 30% projection above is a longer-term, multiyear estimate.
AWS:
Last quarter revenue growth: 17%.
Annual growth rate: 15% to 17%.
Revenue forecast: $105 billion to $106 billion.
Valuation: Implied 10x multiple, making it a potential trillion-dollar company if it were a standalone entity. This is probably a conservative view.
Operating profit: 25% prone to fluctuations.
Azure:
Last quarter reported revenue growth: 28% (public statements for Azure).
Annual growth rate: Close to 30%.
Revenue forecast: $60 billion (Azure worst case based on theCUBE Research model adjustments explained in detail below).
Implied Valuation: 10x multiple, $600 billion to 700 billion (also could be conservative).
Operating profit estimate: 20% to 30%, potentially lower than AWS when isolating on just infrastructure but unclear.
GCP (IaaS/PaaS only).
Last quarter revenue growth: 28%.
Annual growth rate: Maintainable at 28% in our view.
2024 revenue forecast: $20 billion.
Valuation: 5x multiple, lower implied valuation than AWS and Azure.
Operating profit: Less than 10%.
Comparing the on-premises server leaders with hyperscalers reveals a meaningful contrasts in business models and growth trajectories, Supermicro notwithstanding. Supermicro’s extraordinary growth and differentiated business model is something we’re watching as an indicator of on-prem dynamics. Nonetheless, the hyperscalers remain leading players with a combination of massive capital spending investments, AI optionality and excellence and vibrant developer/third-party ecosystems.
Sizing the hyperscale cloud infrastructure market – IaaS and PaaS
Assessing hyperscale infrastructure on an apples-to-apples basis is always a challenge. Though AWS created the market and reports on its business performance, it continues to evolve beyond compute, storage and networking services. It offers up-the-stack services in database and data services, AI tooling such as SageMaker, on-premises infrastructure such as Outposts and now applications such as Q and other services (for example, call center). These nuances make it difficult to not only track AWS’ clean IaaS and PaaS figures, but trying to compare AWS’ business model with Azure and GCP further complicates matters.
Below we attempt to do so.
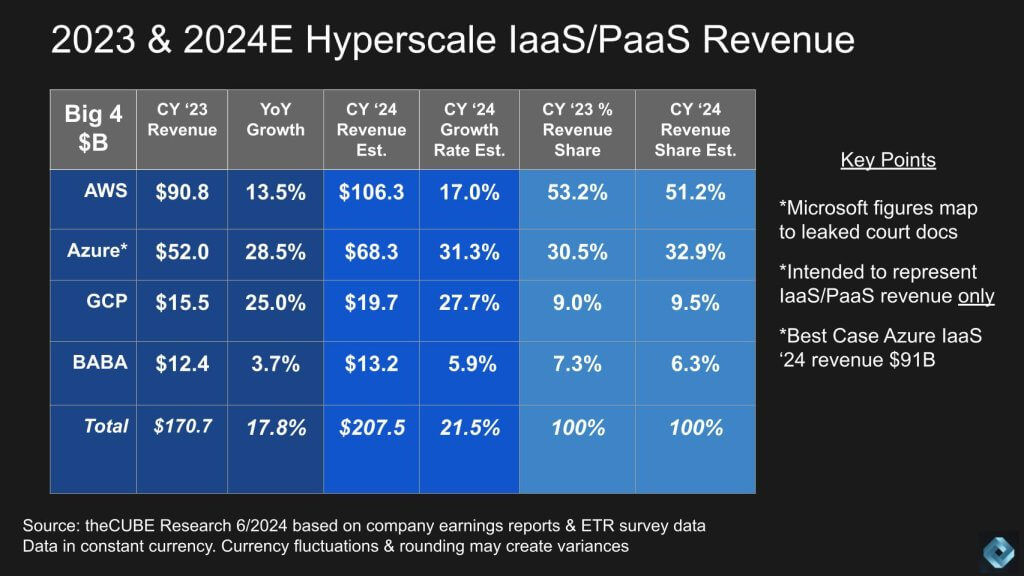
Above we examine theCUBE Research’s revenue estimates for the big four hyperscalers — AWS, Azure, GCP and Alibaba.
Key points
2023 revenue estimates:
AWS: $91 billion.
Azure: $52 billion*.
GCP: Almost $16 billion.
Alibaba: $12.4 billion.
Total market: $170 billion, growing at 17% to 18%.
2024 revenue projections:
AWS: Exceeding $106 billion.
Azure: $68 billion (*lower than many conventional estimates).
GCP: Almost $20 billion.
Alibaba: $13 billion.
Total market: Exceeding $200 billion, growing at 21% to 22%.
Revenue shares and market position:
AWS expected to maintain over 50% market share.
Azure and AWS not expected to crossover in market share based on our IaaS and PaaS definitions*.
*Microsoft figures map to court documents from the Activision lawsuit, focusing on IaaS and PaaS infrastructure revenue only.
Modeling approaches for Azure:
We maintain two models used: apples-to-apples and best-case all-in.
Apples-to-apples model estimates Azure’s 2024 revenue at $68 billion.
Best-case all-in model estimates Azure’s 2024 revenue at upwards of $90 billion to $91 billion.
Note: We attempt to adjust all estimates to constant currency.
The hyperscaler market, driven by AWS, Azure, GCP and Alibaba, is poised for substantial growth, accelerated by the AI trend. AWS continues to dominate with over 50% market share, while Azure’s revenue estimates vary significantly based on different modeling approaches. These projections speak to the dynamic nature of the hyperscaler market and the critical role of AI in shaping its future trajectory.
What is Azure’s true revenue?
Unpacking Microsoft’s Azure numbers is part art, part science. Relying on Microsoft’s public statements about Azure growth is what most pundits and analysts do, but comparing them on an apples-to-apples basis with AWS and GCP is not so straightforward. As such, we maintain two models for Azure to reflect best-case/worst-case scenarios.
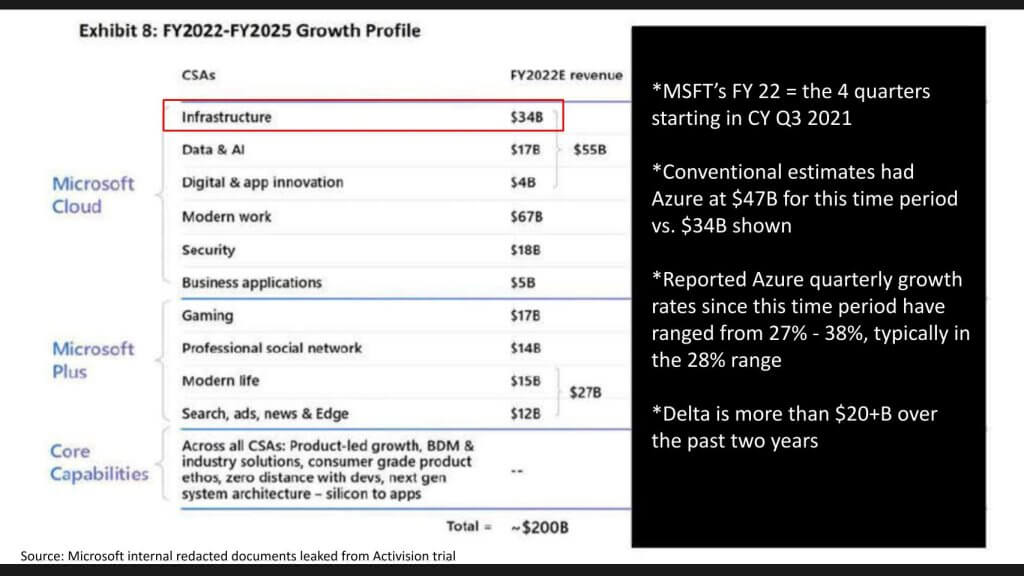
The following analysis explains in greater detail how we approach this problem. It examines Microsoft’s internal documents, leaked during the Activision trial, focusing on Azure’s infrastructure revenue with statements comparing Azure to AWS and Google Cloud. The data below provides a more detailed comparison of the reported and estimated revenues, highlighting the differences between pure infrastructure (IaaS and PaaS) and broader metrics.
The screenshot shown below is instructive and was first reported by The Information a year ago. TheCUBE Research subsequently made attempts to dig further into the data and adjust its market numbers accordingly.
Key points
Microsoft cloud infrastructure revenue:
Internal documents show $34 billion for Microsoft’s fiscal year 2022.
This period includes Q3 2021, Q4 2021, and Q1 and Q2 2022.
Conventional estimates for Azure at that time were around $47 billion.
Reported growth rates:
Quarterly growth rates for Azure have ranged from 27% to 38%, typically around 28%.
The delta between the internal document and conventional estimates is more than $20 billion over two years.
TheCUBE Research team reassessed its model for Azure and revised its projections to fit the $34 billion figure within the four quarters indicated. The problem is that it deviates from certain public statements that Microsoft has made regarding Azure. As such, our assessment is that Azure, as reported by Microsoft, includes items other than IaaS/PaaS infrastructure and is not directly comparable to AWS’ revenue figures.
Azure best-case/worst-case scenarios
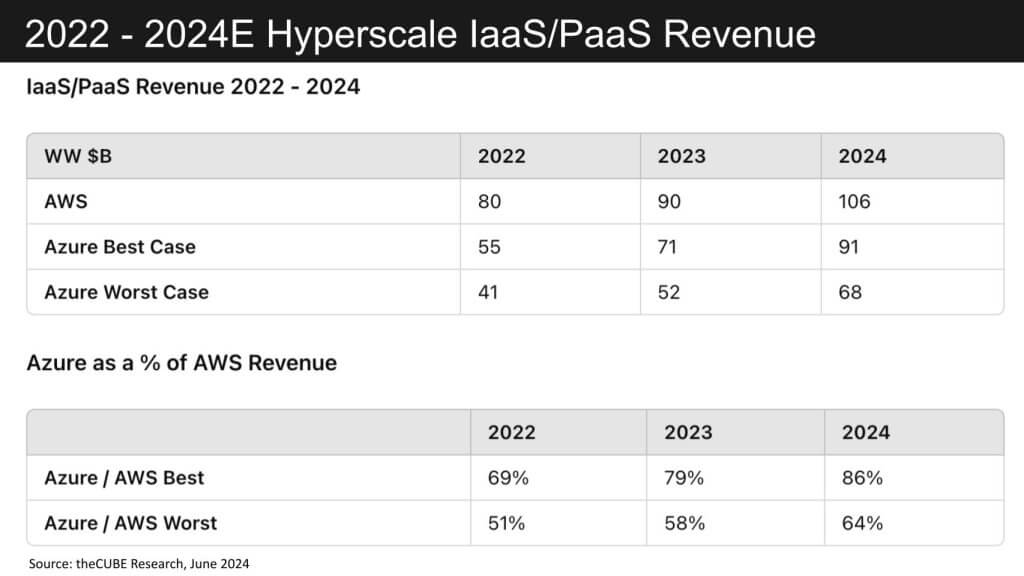
Below we put our two models in context relative to AWS’ reported revenue for the years 2022 and 2023 and our estimates for 2024.
The reported annual and quarterly growth rates for Azure and AWS highlight significant differences in revenue estimates, underscoring the complexity of comparing cloud infrastructure providers.
Key points
Growth rates:
Azure’s quarterly growth rates: 27% to 38%, typically around 28%.
With these growth rates, the delta between the best case and worst case Azure comparisons come to more than $20 billion.
AWS revenue:
2022: $80 billion.
2023: $90 billion.
2024: $106 billion.
Majority of revenue from IaaS and PaaS (compute, storage, networking, platform as a service, and related services).
Azure revenue models:
Best case (all-in):
We believe includes hybrid, on-prem, possibly some security and even SQL server data.
Worst case (apples-to-apples):
Attempts to match AWS’ pure IaaS and PaaS revenues.
Revenue comparison as a percentage of AWS:
Best case: 69% in 2022 growing to 86% expected in 2024.
Worst case: 51% in 2022 to approximately two-thirds of AWS’ revenue in 2024.
Definitions and clarity:
AWS revenue likely includes some non-IaaS and PaaS components as well, which adds further complexity.
Based Microsoft’s own internal documents, Azure’s revenue likely includes various non-infrastructure components, making direct comparison challenging.
Financial definitions from Microsoft’s 10-Ks provide some guidance but remain fuzzy. The following is from the company’s most recent 10-K:
Azure is a comprehensive set of cloud services that offer developers, IT professionals, and enterprises freedom to build, deploy, and manage applications on any platform or device. Customers can use Azure through our global network of datacenters for computing, networking, storage, mobile and web application services, AI, IoT, cognitive services, and machine learning. Azure enables customers to devote more resources to development and use of applications that benefit their organizations, rather than managing on-premises hardware and software. Azure revenue is mainly affected by infrastructure-as-a-service and platform-as-a-service consumption-based services, and per user-based services such as Enterprise Mobility + Security.
While helpful, the above definitions remain opaque. The comparative analysis of AWS and Azure revenues from 2022 to 2024 shows significant disparities depending on the modeling approach. While AWS maintains a strong position with clear IaaS and PaaS revenue streams, Azure’s broader inclusion of hybrid and on-prem components complicates direct comparisons. The best-case and worst-case models for Azure demonstrate a wide range in revenue estimates, highlighting the need for careful interpretation of financial data in understanding the true market positions of these cloud giants.
Spending profiles for leading cloud players
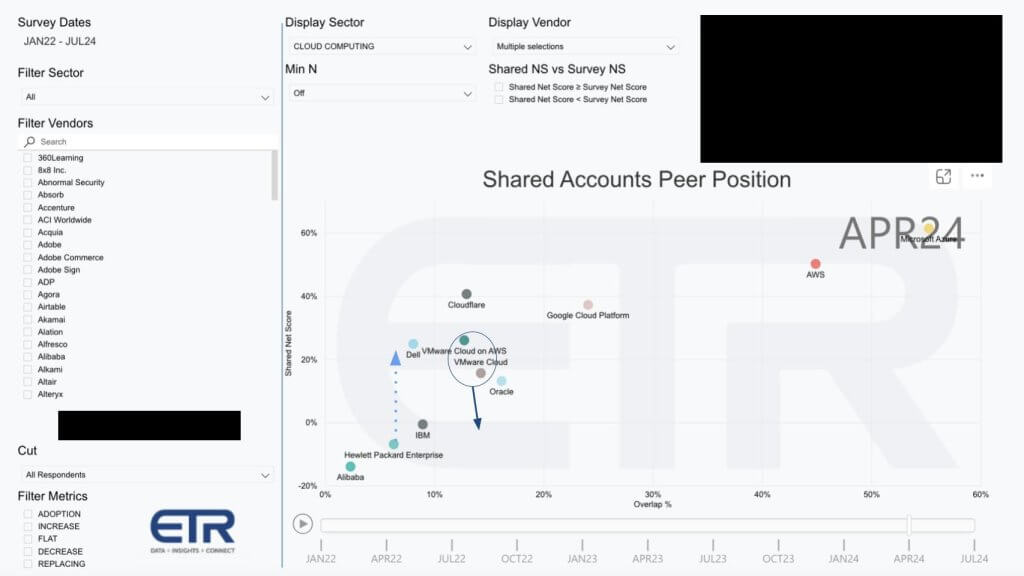
Let’s take a look at the ETR data from the April survey and provide some clues for the survey that’s currently in the field.
The ETR data above provides insights into the spending momentum and market penetration of various companies in the cloud computing sector. This analysis, based on the April survey, offers a snapshot of customer spending trends and market positioning, with redacted data from the July survey, which is currently in the field.
Key points
Axes definitions:
Vertical axis (Net Score): Measure of spending momentum (net percent of customers spending more vs. less). A score above 40% is considered exceedingly high.
Horizontal axis (Penetration): Proxy for market penetration or share, indicating overlap within the dataset.
Market leaders:
Microsoft: Despite being ubiquitous and ahead in customer penetration, its Net Score remains high, showing strong spending momentum.
AWS: Similarly, maintains a high Net Score above 40%, indicating robust spending momentum.
Cloudflare: Also above the 40% net score threshold.
Google Cloud Platform: Close to the 40% mark but remains a distant third in customer penetration compared with AWS and Microsoft.
Upcoming survey insights:
HPE: Showing significant positive movement, jumping from negative to positive zone, aligning with its recent earnings.
Dell: Previously made a similar positive shift.
Other players:
IBM Cloud: Net Score hovers around the zero line, indicating lack of meaningful momentum. This is driven by the fact that, in the survey (N~165), as many IBM customers are spending less as are spending more, driving their Net Score in cloud to essentially zero.
VMware Cloud on AWS and VMware Cloud (VCF): Shows downward Net Score pressure, consistent with Broadcom’s strategy to focus on the largest customers and increase contract value with bundled offerings. Broadcom assets rarely play well in the ETR data set because ETR measures percentage of customers, not revenue. Broadcom’s strategy is to narrow the focus on its largest customers, better target its R&D and increase the content of Broadcom intellectual property within each customer. This strategy produces higher contract values, which is not reflected in the ETR data set.
Oracle: Has a similar dynamic in the data set to Broadcom in that it sells value to a narrower set of enterprise customers, which reflects as lower Net Scores in the ETR survey data. Oracle’s stock is at an all-time high and the company is executing on a highly differentiated strategy, focused on hardware and software integration and mission critical workloads.
The ETR data highlights the strong spending momentum and market penetration of leading cloud providers, particularly Microsoft and AWS. The glimpse into the upcoming survey suggests a significant move by HPE. This view of the market underscores the dynamic nature of the cloud computing sector, with shifts in customer spending and strategic positioning shaping the competitive landscape.
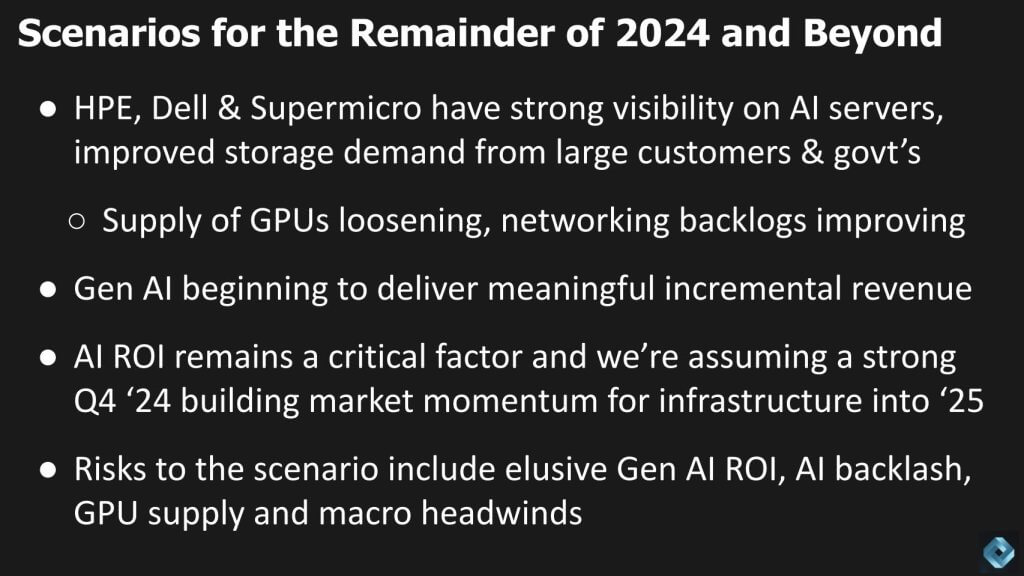
Scenarios for the balance of 2024
As we look toward the remainder of 2024 and beyond, the visibility on AI server growth and storage demand for companies like HPE, Dell and Supermicro is exceptionally strong. In addition, the ETR data shows improved momentum in storage, which is poised to boost these companies significantly thanks to higher gross margins in storage.
Key points
AI server growth and storage demand:
HPE, Dell and Supermicro show strong visibility on AI server growth.
Improved storage demand will drive a favorable product mix.
Gross margins in storage:
Storage has significantly higher gross margins (high 50s to mid-60s).
Pure Storage even higher than the typical range.
Positive impact on P&L and bottom line thanks to high margins.
Demand sources:
Large customers, governments, cloud service providers and MSPs.
Loosening supply of GPUs and improving network backlogs at Cisco and HPE Aruba.
Generative AI revenue impact:
Incremental revenue from gen AI starting to show in cloud numbers.
Microsoft’s Azure showing a gen AI tailwind and in incremental 7%, up from 6% last quarter.
AWS’s accelerated growth rate also benefitting from AI momentum.
Google gaining ground on AWS in AI, though data is still being analyzed.
AI ROI and market conditions:
AI return on investment critical for our 2024 predictions to come through. Without stronger AI ROI in the enterprise, markets will remain choppy, in our view.
Our current scenario calls for a strong Q4, buoyed by AI, building momentum into 2025.
Risks to our scenario include potential AI backlash if ROI does not materialize, GPU supply concerns.
Hybrid cloud dynamics – It’s a hybrid world but repatriation is not a measurable trend:
Hybrid cloud narratives acknowledge continued relevance.
On-prem growth rates significantly outpaced by cloud computing.
One callout from HPE’s earnings print – its hybrid cloud business declined in high single digits last quarter.
Sovereign cloud demand:
Benefits traditional legacy on-prem players due to data sovereignty needs.
Large companies installing servers in own data centers for AI ROI.
Looking ahead, AI server growth and storage demand provide a robust outlook for HPE, Dell and Supermicro, supported by stronger gross margins. The hybrid cloud story remains relevant but is outpaced by cloud computing growth rates. Sovereign cloud demand and AI ROI will be critical factors moving forward. The upcoming HPE Discover event will shed more light on these trends and their implications for the industry.
Tune in for more updates and insights from our coverage on siliconangle.com and thecube.net.
What’s your call for 2024 and beyond? Will on-prem momentum continue into 2025 for AI servers? Can Supermicro maintain triple digit growth rates? Will cloud players’ growth rates continue to stay at current levels or will they decelerate? Or will AI provide a tailwind that accelerates their growth rates?
Keep in touch
Thanks to Alex Myerson and Ken Shifman on production, podcasts and media workflows for Breaking Analysis. Special thanks to Kristen Martin and Cheryl Knight, who help us keep our community informed and get the word out, and to Rob Hof, our editor in chief at SiliconANGLE.
Also, check out this ETR Tutorial we created, which explains the spending methodology in more detail.
Note: ETR is a separate company from theCUBE Research and SiliconANGLE. If you would like to cite or republish any of the company’s data, or inquire about its services, please contact ETR at legal@etr.ai or research@siliconangle.com.
All statements made regarding companies or securities are strictly beliefs, points of view and opinions held by SiliconANGLE Media, Enterprise Technology Research, other guests on theCUBE and guest writers. Such statements are not recommendations by these individuals to buy, sell or hold any security. The content presented does not constitute investment advice and should not be used as the basis for any investment decision. You and only you are responsible for your investment decisions.
Disclosure: Many of the companies cited in Breaking Analysis are sponsors of theCUBE and/or clients of theCUBE Research. None of these firms or other companies have any editorial control over or advanced viewing of what’s published in Breaking Analysis.
Image: theCUBE Research/DALL-E
A message from John Furrier, co-founder of SiliconANGLE:
Support our mission to keep content open and free by engaging with theCUBE community. Join theCUBE’s Alumni Trust Network, where technology leaders connect, share intelligence and create opportunities.
15M+ viewers of theCUBE videos, powering conversations across AI, cloud, cybersecurity and more
11.4k+ theCUBE alumni — Connect with more than 11,400 tech and business leaders shaping the future through a unique trusted-based network.
About SiliconANGLE Media
SiliconANGLE Media is a recognized leader in digital media innovation, uniting breakthrough technology, strategic insights and real-time audience engagement. As the parent company of SiliconANGLE, theCUBE Network, theCUBE Research, CUBE365, theCUBE AI and theCUBE SuperStudios — with flagship locations in Silicon Valley and the New York Stock Exchange — SiliconANGLE Media operates at the intersection of media, technology and AI.
Founded by tech visionaries John Furrier and Dave Vellante, SiliconANGLE Media has built a dynamic ecosystem of industry-leading digital media brands that reach 15+ million elite tech professionals. Our new proprietary theCUBE AI Video Cloud is breaking ground in audience interaction, leveraging theCUBEai.com neural network to help technology companies make data-driven decisions and stay at the forefront of industry conversations.


 CLOUD
CLOUD