


 NEWS
NEWS
NEWS
NEWS
NEWS
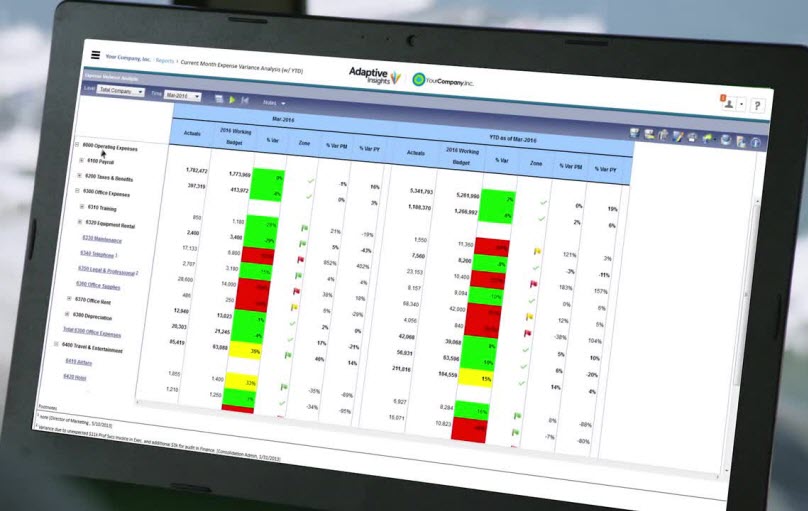
Well-funded corporate performance management software vendor Adaptive Insights Inc. has improved data integration and visualization features in the latest release of its cloud-based Adaptive Suite, while giving corporate financial professionals more features to perform “what-if” analysis from within their familiar desktop tools.
Adaptive Insights is one of the hottest new vendors in the performance management market, having raised $75 million in a funding round last year to bring its total funding to more than $176 million. The market originated in the early 1990s with companies like Hyperion Solutions Corp. (now part of Oracle) and Arbor Software Corp. (ditto) as a specialized but lucrative subset of the overall business intelligence market oriented toward providing operational analytics to executives. Adaptive Insights says it has three times as many customers as all other cloud-based corporate performance management providers combined.
“Corporate performance management is about giving the chief financial officer tools to aggregate historic performance and do analytics around that data,” said Matt Shore, the company’s vice president of product strategy. “Once a plan is in place, you execute against it and monitor results to understand why you deviated from plan.”
Release 2016.2 extends the Adaptive Integration platform across the entire Adaptive Suite, including planning, consolidation and discovery. Users can join together data from multiple sources to create new views, and finance users can now extract data from popular enterprise resource planning (ERP) and customer relationship management (CRM) systems using a web interface. A pre-configured adapter for use with NetSuite Inc.’s CRM software enables users to import NetSuite data such as project, employee and vendor information into the Adaptive Suite for planning and reporting.
A new feature of Active Sparklines – which are small, live, chart widgets – combines trend analysis with data trends. The introduction of visual data editing makes Sparklines interactive. Planners can zoom in to Active Sparklines to reveal trend details. If the metric in question is editable, planners can adjust the underlying data by dragging the data points of the Active Sparkline until the desired trend is achieved.
Users can also now create data visualizations with a single click on selected data in an Adaptive Planning ‘sheet.’ These visualizations can be easily augmented for variance analysis, shared, and even published on dashboards with a single click, the company said.
The release also adds new flexibility that enables users to view their plans and perform data entry in Microsoft Excel while taking advantage of Adaptive Insights’ cloud-based collaborative financial planning application. Users can drill into details in the cloud directly from Excel.
Prices start at $800 per user per year.
THANK YOU