


 CLOUD
CLOUD
CLOUD
CLOUD
CLOUD
Cloud computing is generally seen as a bright spot in tech spending, but the sector is not immune from the effects of COVID-19.
It’s better to be cloud than not cloud, no question, but recent survey data shows that the V-shaped recovery in the stock market looks much more like a square root sign for information technology spending in 2020. And even the cloud will be hurt, albeit much less so than many other sectors.
Welcome to this week’s Wikibon CUBE Insights, powered by Enterprise Technology Research. In this Breaking Analysis we want to update you on our latest data and thinking around the cloud computing market with an emphasis on infrastructure as a service. We will also update our latest quarterly estimates of the Big Three and with our typical trailing-12-month view.
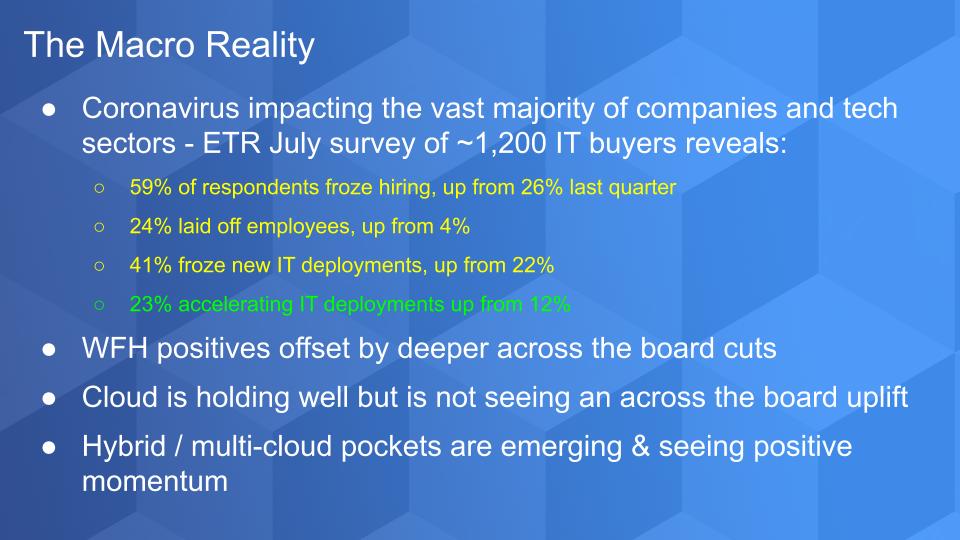
The reality is that the latest ETR survey of nearly 1,200 respondents shows that the vast majority of companies are hitting IT budgets. Notably:
The one positive is coming from the work-from-home and COVID-19 tailwind segments. Cloud computing is one of those, but these spending shifts are not enough to offset the overall outlook for 2020 and likely into 2021. Because the big cloud players, especially Amazon Web Services Inc. and Microsoft Corp.’s Azure, are so large, they are exposed to industries that have been hard-hit by the pandemic. As a result, we see pockets of spending deceleration even at these companies.
The other piece of data that has our attention is the hybrid and multicloud market is beginning to show spending momentum. This is particularly notable within VMware Inc. and Red Hat accounts and we even see a bit of momentum for Oracle Corp.’s cloud that we’ll explore in a moment.
What we show below are some of the verbatim comments from ETR customers, and one of the things we appreciate about the survey is it includes both quantitative and qualitative data that we can sort by industry. We’ve highlighted a few examples that underscore some of the broad-based pain that companies are facing.
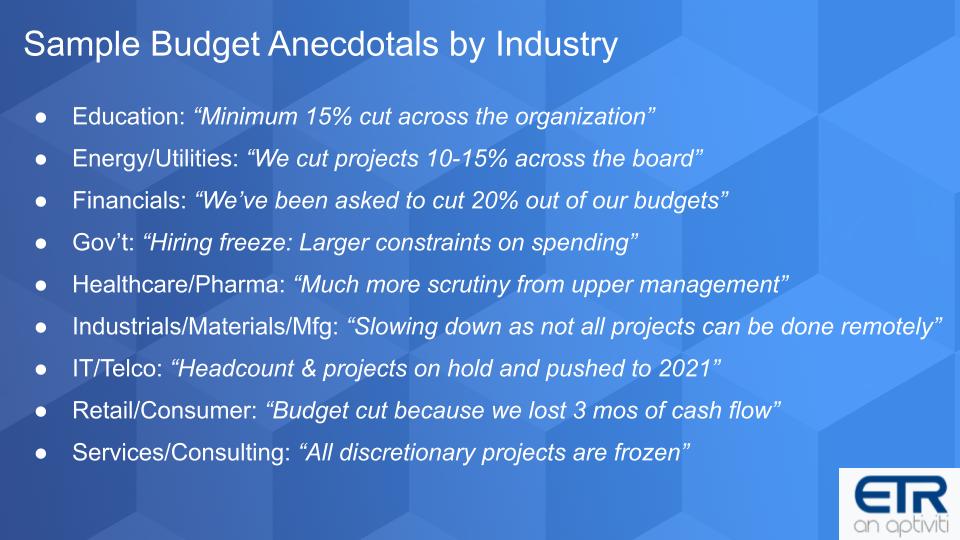
Education: “Minimum 15% cut across the organization.”
Energy/Utilities: “We cut projects 10-15% across the board.”
Financials: “We’ve been asked to cut 20% out of our budgets.”
Government: “Hiring freeze: Larger constraints on spending.”
Healthcare/Pharma: “Much more scrutiny from upper management.”
Industrials/Materials/Manufacturing: “Slowing down as not all projects can be done remotely.”
IT/Telco: “Headcount & projects on hold and pushed to 2021.”
Retail/Consumer: “Budget cut because we lost 3 months of cash flow.”
Services/Consulting: “All discretionary projects are frozen.”
These comments are predominantly from large companies that are big spenders. In fairness, there are some positives in the anecdotal responses, but in squinting through hundreds and hundreds of comments, this pretty much sums up the sentiment.
This is especially true in the all-important U.S. market. We heard this in Cisco’s earnings call this week. The theme is uncertainty related to the pandemic and this is hitting IT budgets.
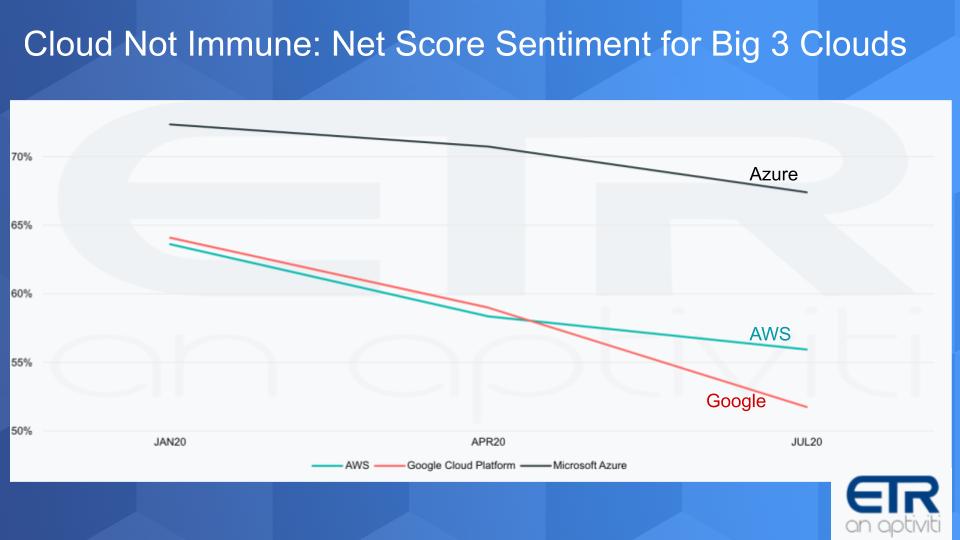
The chart below shows Net Score for the Big Three cloud players – Microsoft, Amazon and Google – for each of the three surveys of 2020. Net Score is ETR’s measure of spending momentum. Each quarter ETR asks buyers, “Are you spending more or less on a platform?” and Net Score subtracts the lesses from the mores. It’s a bit more complicated than that, but that’s the essence. And you can see the deceleration in all three platforms. Now it’s important to point out that these are already at elevated levels and represent strength. But there is clear pressure on spending, even in cloud.
There are clear pockets of spending strength such as video conferencing and security that are winning. However, even in these sectors, it’s often a story of a firm that is well positioned to gain share – like a Zoom Video Communications Inc. or Okta Inc. or CrowdStrike Holdings Inc. or Zscaler Inc. or Sailpoint Technologies Inc. that we’ve highlighted in previous segments.
This slide shows data from multiple ETR surveys. The pies compare the spring survey to the summer sentiment, asking buyers, “Will COVID impact your IT budget in 2020?” In the latest COVID survey, 78% say yes, up from 63% from the last survey.
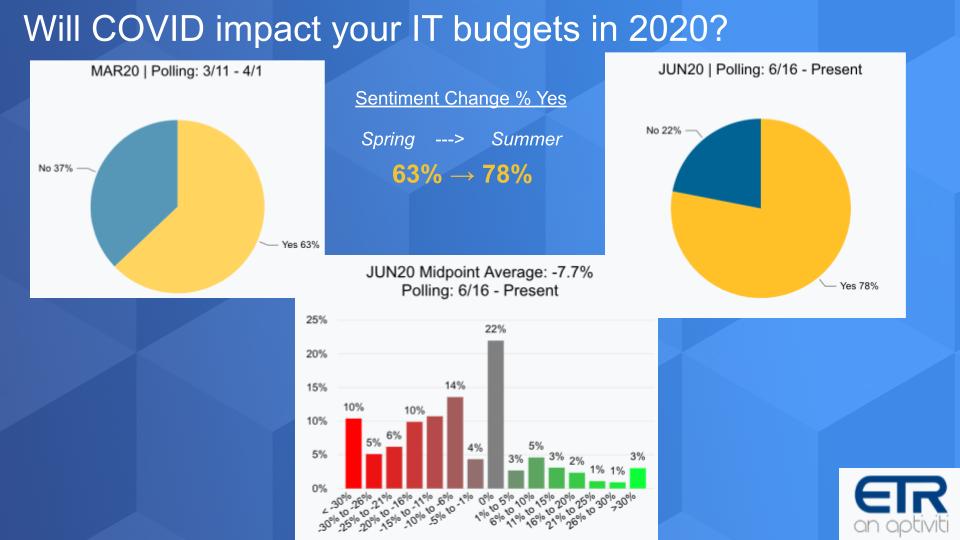
The bar chart answers the next obvious question: “How will your budget be impacted?” You can see the distribution of growth or decline in the reds and greens. A sizable portion, 22%, say no change in budget, but the red bars are much bigger than the green bars and that’s why we continue to forecast IT spending declines of 5% to 8% in 2020. We think this will spill into the first half of 2021 as well.
Now despite my somewhat dire outlook, we have to remember that it’s all relative.
The chart below shows one of our favorite views. It plots Net Score – or spending momentum – on the vertical axis against Market Share on the horizontal axis. Market Share is measure of pervasiveness in the survey and calculates the penetration of the sector as a percentage of the overall survey.
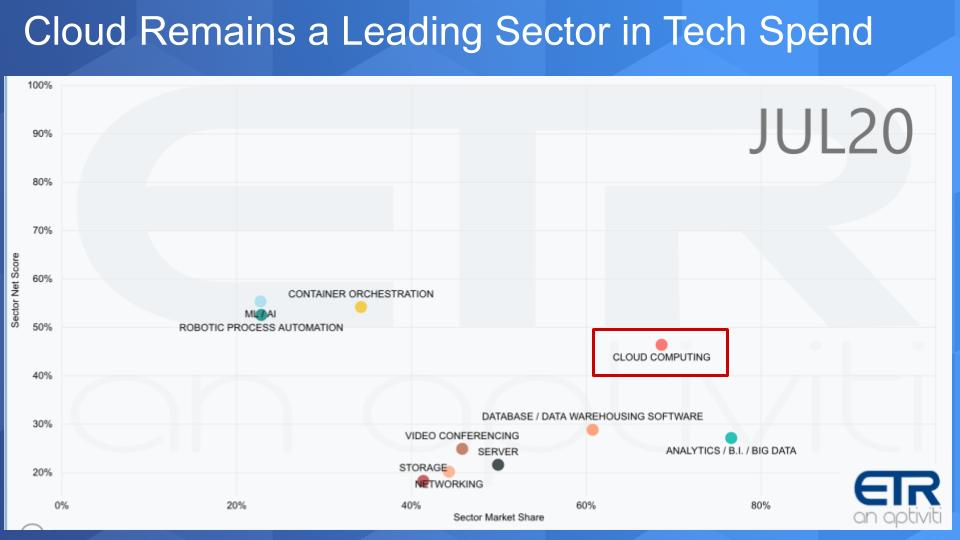
What this view tells us is the degree of spending momentum on the vertical axis: Cloud is elevated relative to the other sectors we’re showing. And it shows the penetration of cloud in the dataset on the horizontal axis. So cloud shows both spending momentum and high penetration relative to other spending priorities. Note there are dozens of other sectors in the ETR data set but we’ve cherry-picked a few here for context.
The upshot: Other than containers, artificial intelligence and robotic process automation, cloud is outpacing all sectors shown in terms of Net Score and only analytics/business intelligence/big data is more pervasive. So cloud remains strong but as we’ll see in the next section, there are COVID-19 headwinds.
We showed earlier the decline of Net Scores for the Big Three – again still holding elevated levels. What this chart below shows is the sectors of infrastructure as a service that demonstrate increasing Net Scores relative to the last survey. And you can see there are only five areas that show positive increases in Net Score.
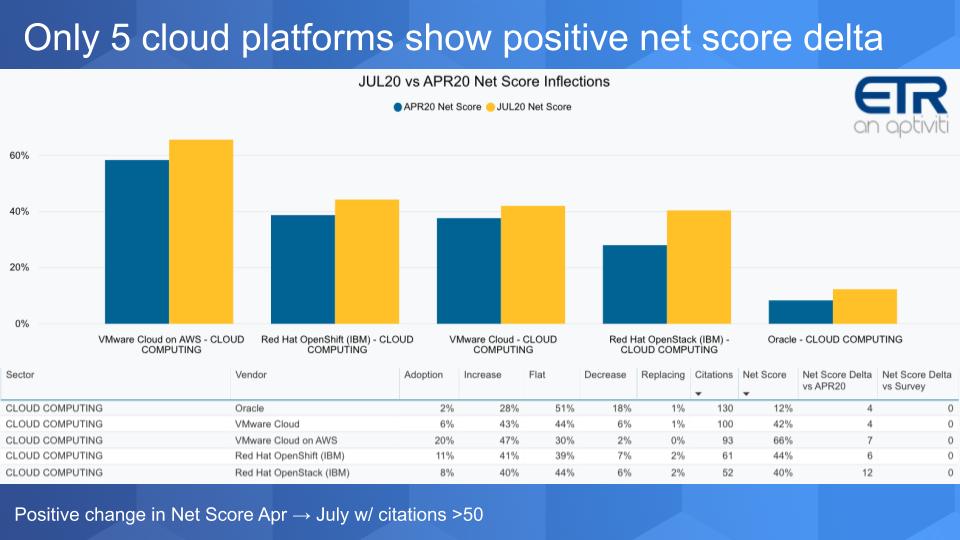
Reading the bars left to right:
So these are the only five areas showing Net Score expansion from the last survey, which speaks to the impact of COVID that we discussed earlier.
What we show below are the top ten cloud services measured by Net Score or spending momentum. This is for the July survey of 1,195 respondents.
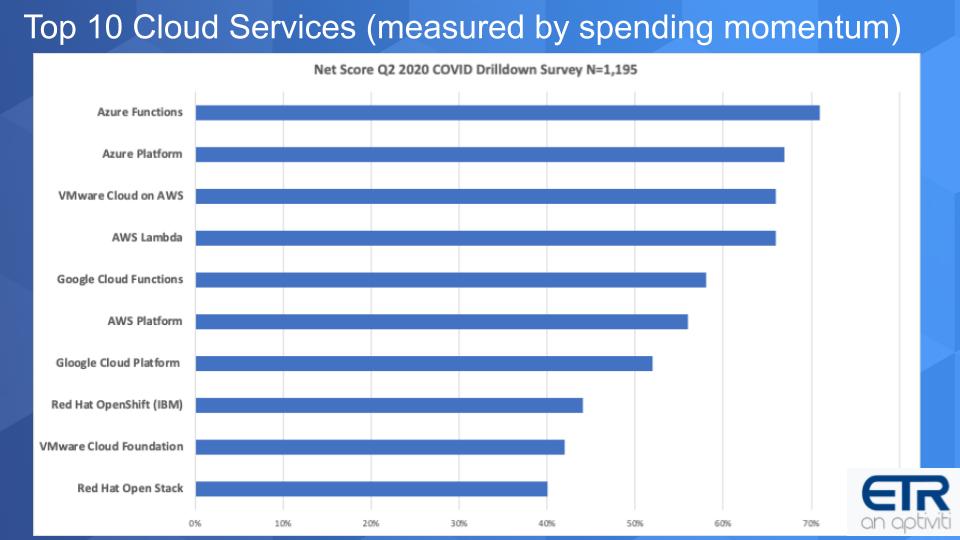
The first point is these are all solid Net Scores – so while we are putting forth a less-than-sanguine outlook for 2020, these are very strong scores relative to most other parts of the technology stack. Most companies would kill to have this type of momentum.
Azure functions and Azure platform lead the pack in Net Score. But look at VMware Cloud on AWS. We’ve seen this popping up in recent surveys and showing strong. This service is doing well and gaining presence and momentum in the data set. Then there’s AWS Lambda, which is “functions” or serverless; it remains strong, as does Google Functions.
Next you see AWS – that’s AWS overall and even though it’s off a bit in Net Score terms from previous quarters, this is a $40 billion annual business with Net Scores that remain elevated. Remember that Net Scores can’t grow to the moon. They will fluctuate, and the larger the base, the harder it is to maintain high Net Scores, so the AWS performance is very impressive.
Google Cloud Platform is next and frankly we’d like to see stronger Net Scores. GCP is around one-eighth the size of AWS and yet AWS still maintains a notably higher Net Score each survey. Google continues to struggle with selling into the enterprise.
Now look at the last three on the chart above. Cloud purists might say that these hybrid or multicloud services aren’t “real cloud,” but these are customer responses and if the customer says they’re cloud, we’ll go with that. Forgetting about the semantics, the point is we’ve been talking about hybrid and multicloud for a while and we see VMware and Red Hat – two companies that we’ve predicted are in a strong position to compete for hybrid and multicloud — are showing up on customers’ spending radar.
We should also mention that Microsoft is a leader if not the leader in hybrid and multicloud because it has a massive public cloud presence and numerous relevant services in the space. Microsoft doesn’t show up necessarily as discrete hybrid services in the ETR taxonomy, but its hybrid services are likely embedded in these numbers.
On the graph below, this time we show specific named vendors. On the y axis is Net Score or spending velocity and on the x axis Market Share or pervasiveness.
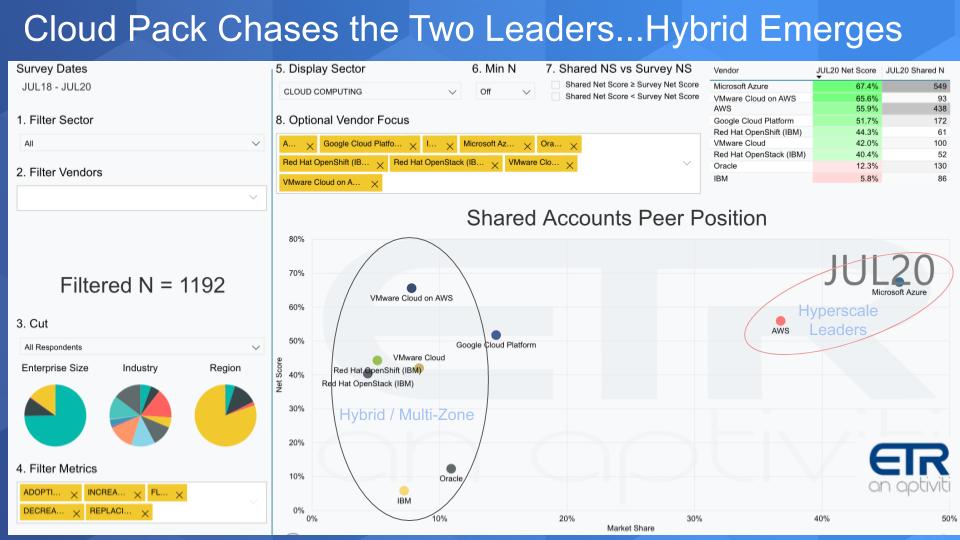
As usual, we see AWS and Azure separating from the pack. In our view, infrastructure as a service and platform as a service collectively is such a huge market that it’s not winner-take-all. Maybe not even winner-take-most.
You can see the players that we’ve highlighted in the Hybrid/Multi- Zone, with Google on the bubble. Any player on this chart with a Net Score above 40% is in the green, as you can see in the upper right corner. Red Hat, VMware Cloud, Google. And look at VMware Cloud on AWS: This service is getting a lot of traction and it should, given the effort both companies have put behind this.
Notably, AWS has created special bare-metal instances to run this service on its cloud. VMware refers to AWS as its preferred partner. This service has been a winner for both companies. AWS gets access to 500,000 VMware customers and VMware gets a really solid cloud play.
Where this goes in the future will be interesting to watch. When this service was announced several years ago, it didn’t take long for AWS to launch its VMware migration services. But for now it’s a win-win for the two companies and a win for customers.
For context we’ve included both Oracle and IBM Corp. cloud services and you can see where they stand relative to the rest. They’re not setting the world on fire, but as we’ve said many times, they at least are in the cloud game. And both companies are in a good position to migrate their customers’ mission critical workloads to their respective clouds.
As has been our custom, we like to share our estimates of how the big U.S. cloud players stack up as shown in the chart below. The data puts forth our IaaS and PaaS revenue estimates for AWS, Azure and Google Cloud Platform for 2018, 2019, 2019 growth rates, the first two quarters of 2020 and a trailing-12-month view.
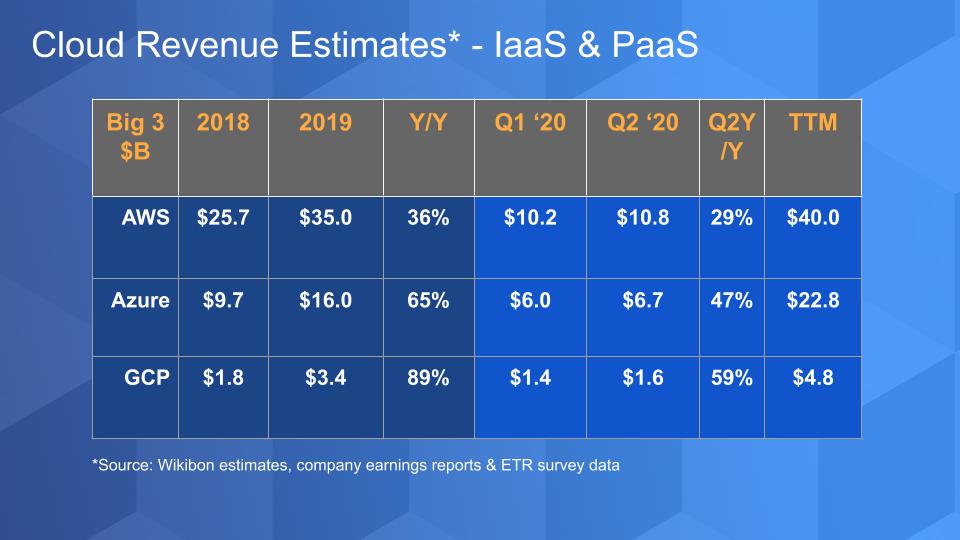
Below are the five key takeaways. Remember, AWS reports clean numbers. Microsoft blends Azure revenue with other services, as does Google with GCP. So we have to read through a variety of financial reports and triangulate with survey data to come up with an apples to apples comparison.
The bottom line: Despite the COVID headwinds in the overall IT market, there’s little question that this is a cloud world and we just live in it.
Look for survey updates on the ETR Web site and make sure to check out SiliconANGLE for all the news and analysis. Remember these episodes are all available as podcasts wherever you listen. Also, you may want to check out this ETR Tutorial we created, which explains the spending methodology in more detail.
Ways to get in touch: Email david.vellante@siliconangle.com, DM @dvellante on Twitter and comment on our LinkedIn posts.
Here’s this week’s full video analysis:
Support our mission to keep content open and free by engaging with theCUBE community. Join theCUBE’s Alumni Trust Network, where technology leaders connect, share intelligence and create opportunities.
Founded by tech visionaries John Furrier and Dave Vellante, SiliconANGLE Media has built a dynamic ecosystem of industry-leading digital media brands that reach 15+ million elite tech professionals. Our new proprietary theCUBE AI Video Cloud is breaking ground in audience interaction, leveraging theCUBEai.com neural network to help technology companies make data-driven decisions and stay at the forefront of industry conversations.