


 CLOUD
CLOUD
CLOUD
CLOUD
CLOUD
The overall technology spending outlook is deteriorating. And yet there are positive signs making things unpredictable.
The negative sentiment is, of course, being driven by macroeconomic factors and earnings forecasts that have been coming down all year while interest rates keep rising. Making matters worse is that many people think earnings estimates are still too high.
It’s understandable why there’s so much uncertainty. Technology continues to boom. Digital transformations are happening in earnest. Leading companies have momentum and long cash runways. Moreover, the chief executives of these leading companies are still really optimistic. But strong guidance in an environment of uncertainty is risky and makes navigation more challenging.
In this Breaking Analysis, we try to put some guardrails on the market by sharing takeaways from from Enterprise Technology Research’s latest spending survey, which was released to their private clients on Oct. 21. Today we’re going to review the macro spending data, convey where chief information officers think their cloud spend is headed, look at the actions organizations are taking to manage uncertainty, and then review some of the technology companies that have the most positive and negative outlooks in the ETR data set.
Let’s look at the sample makeup from the latest ETR survey.
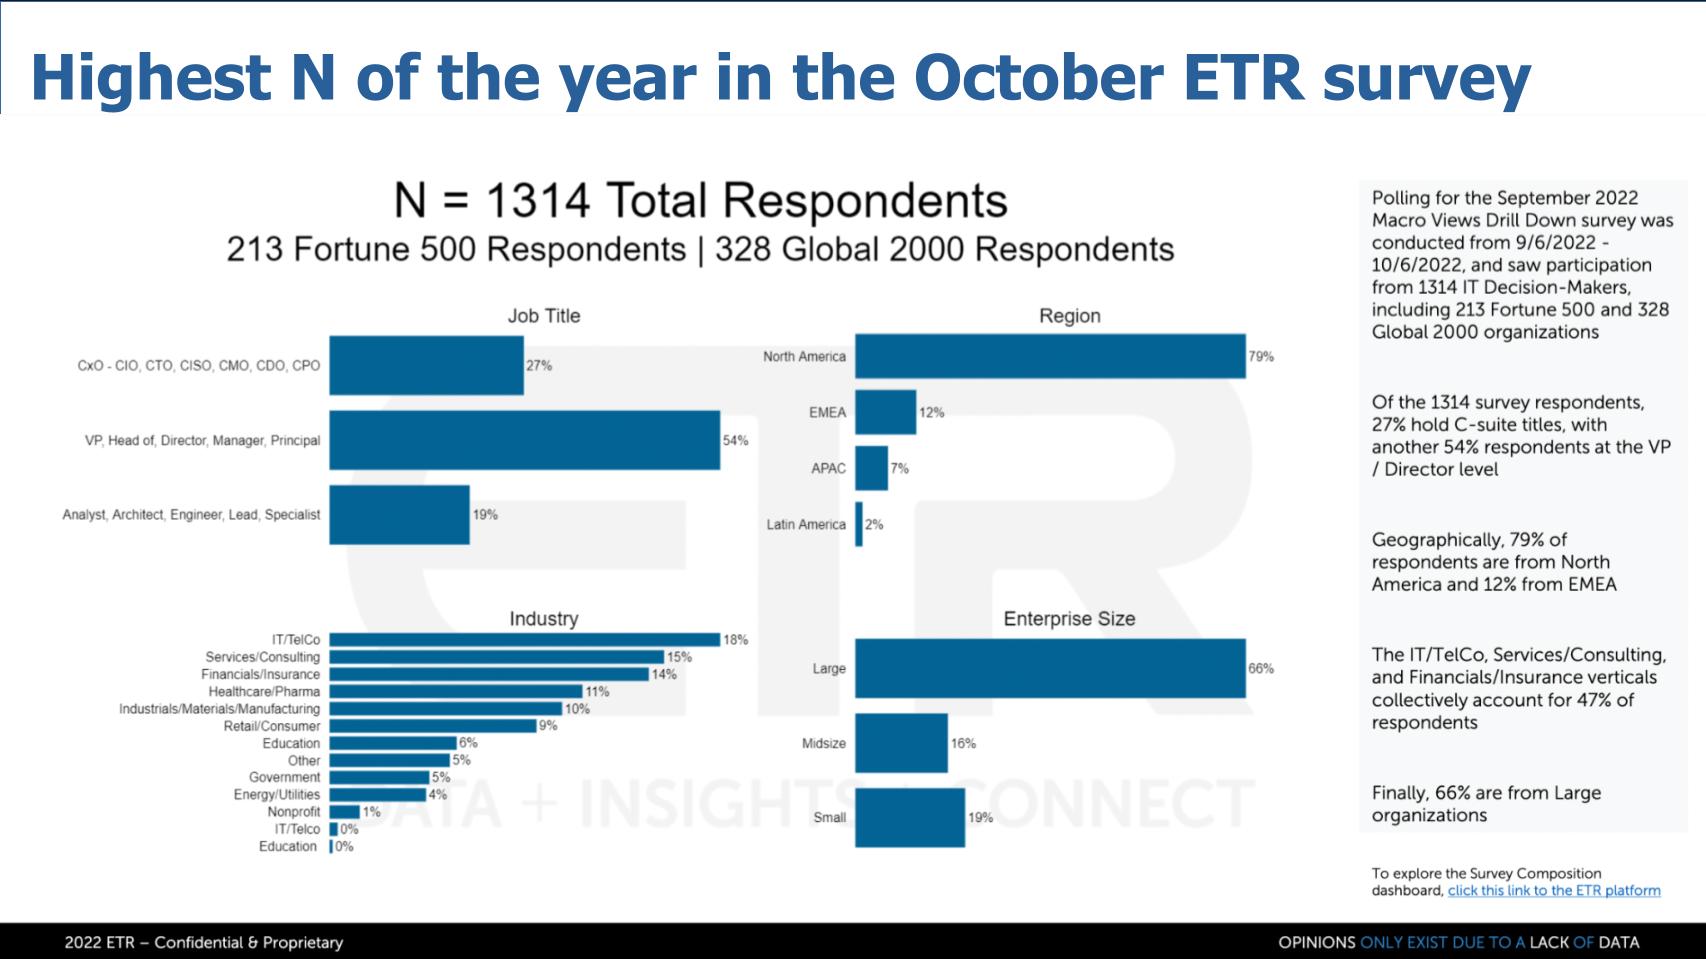
ETR captured more than 1,300 respondents in the latest survey, its highest for the year. The quality and seniority of respondents just keeps going up each time we dig in, with large contributions from C-level executives (27%) and a broad industry focus. The survey is still North America-centric, with just 20% of the respondents coming from overseas. And there’s a weighting toward larger organizations (66%). Nonetheless, we’re still talking well over 400 respondents coming from small and medium-sized businesses.
ETR, for those of you who don’t know, conducts a quarterly spending intentions survey and periodic drill-downs that aim to double-click on some of the most important issues of the day.
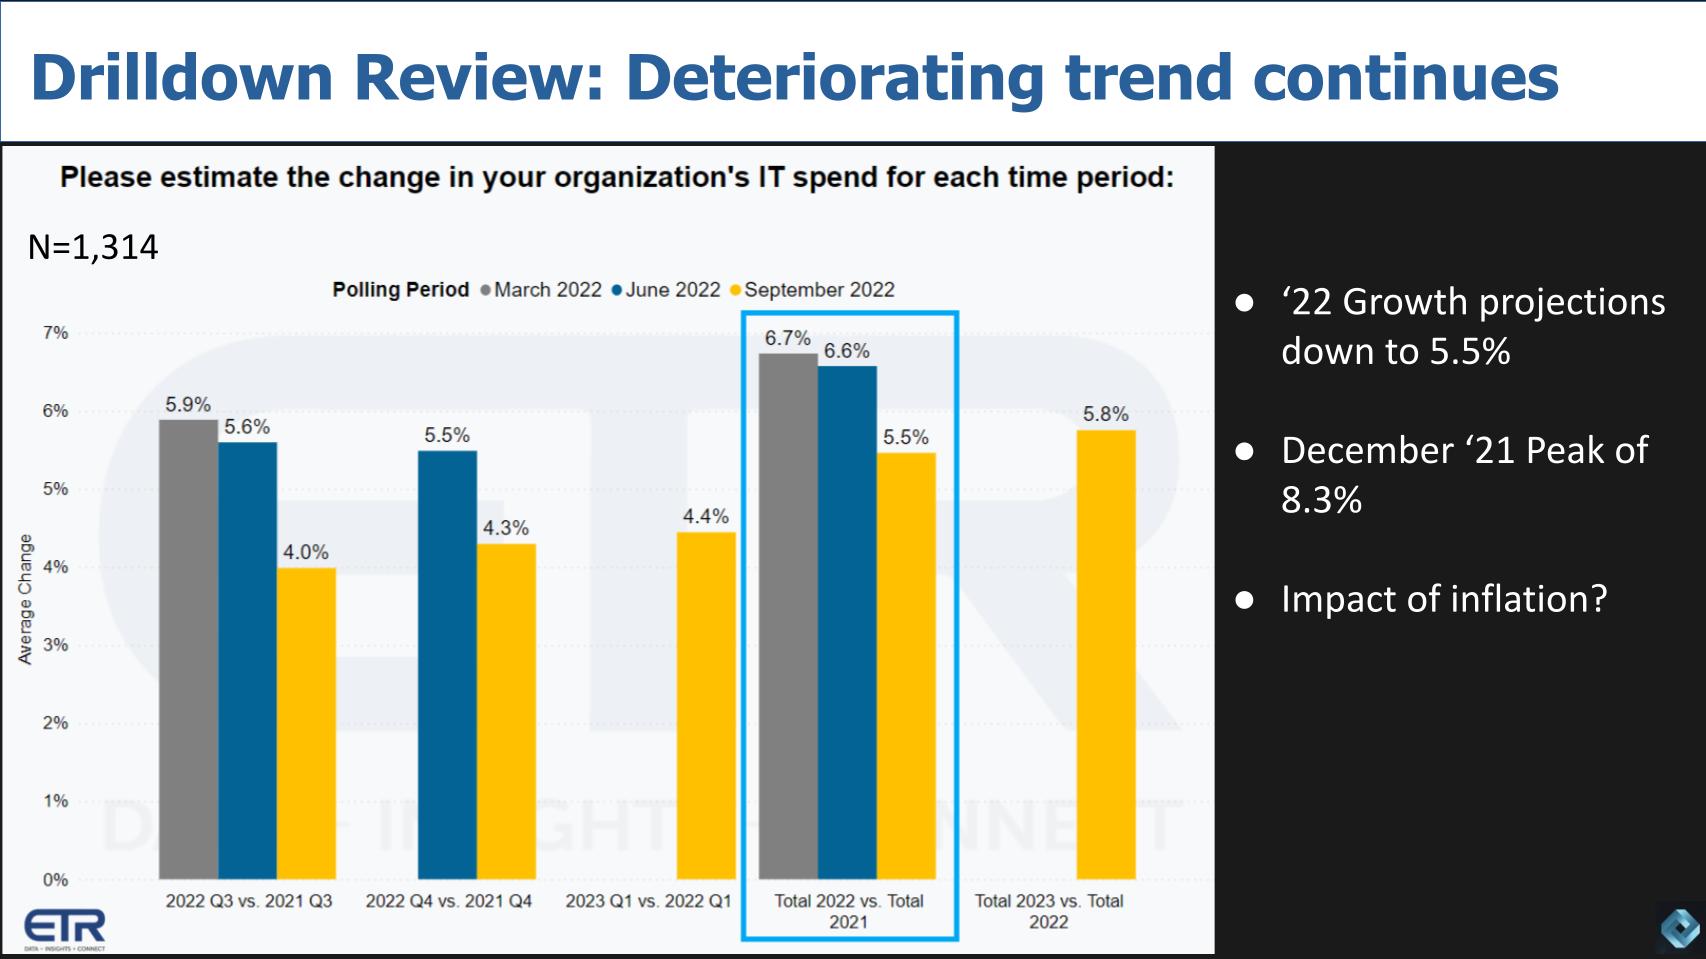
By way of review… The chart above looks at the expectations for information technology spending in the latest drill-down.
Followers of Breaking Analysis know we reported on this a couple of weeks ago. Spending expectations peaked last December at 8.3% and are now down to 5.5%, with a slight uptick expected for next year, as shown above.
One CIO in the ETR community said these figures could be understated because of inflation. That’s an interesting comment. Real GDP in the U.S. is forecast to be around 1.5% in 2022. Nominal GDP (i.e., GDP without adjustments for inflation) is forecast to be significantly higher than what’s shown here – it was over 9% in June. And one would assume that survey respondents are talking about real dollars in the ETR data.
One CIO in the ETR community said these figures could be understated because of inflation.
And you might be thinking: “If nominal GDP is in the high single digits, this means that IT spending is below GDP.” But the flip side of that is technology tends to be deflationary because prices come down over time on a per-unit basis, so this would be a normal and even positive trend. But it’s mixed right now, with prices on hard-to-find hardware holding more firm. Software tends to be driven by lock-in, switching costs (which keep prices up) and of course competition (which pressures prices). Services can be inflationary as wages rise… but certain sectors such as laptops and semis and NAND flash memory are seeing less demand and are deflationary right now.
As such, the way to look at this data is on a relative basis. In other words, IT buyers are reporting a 280-basis-point drop in spending sentiment from the end of last year and it’s entirely likely this trend will continue into 2023.
Something we haven’t previously shared from drill-down surveys is how IT buyers are thinking about cloud adoption.
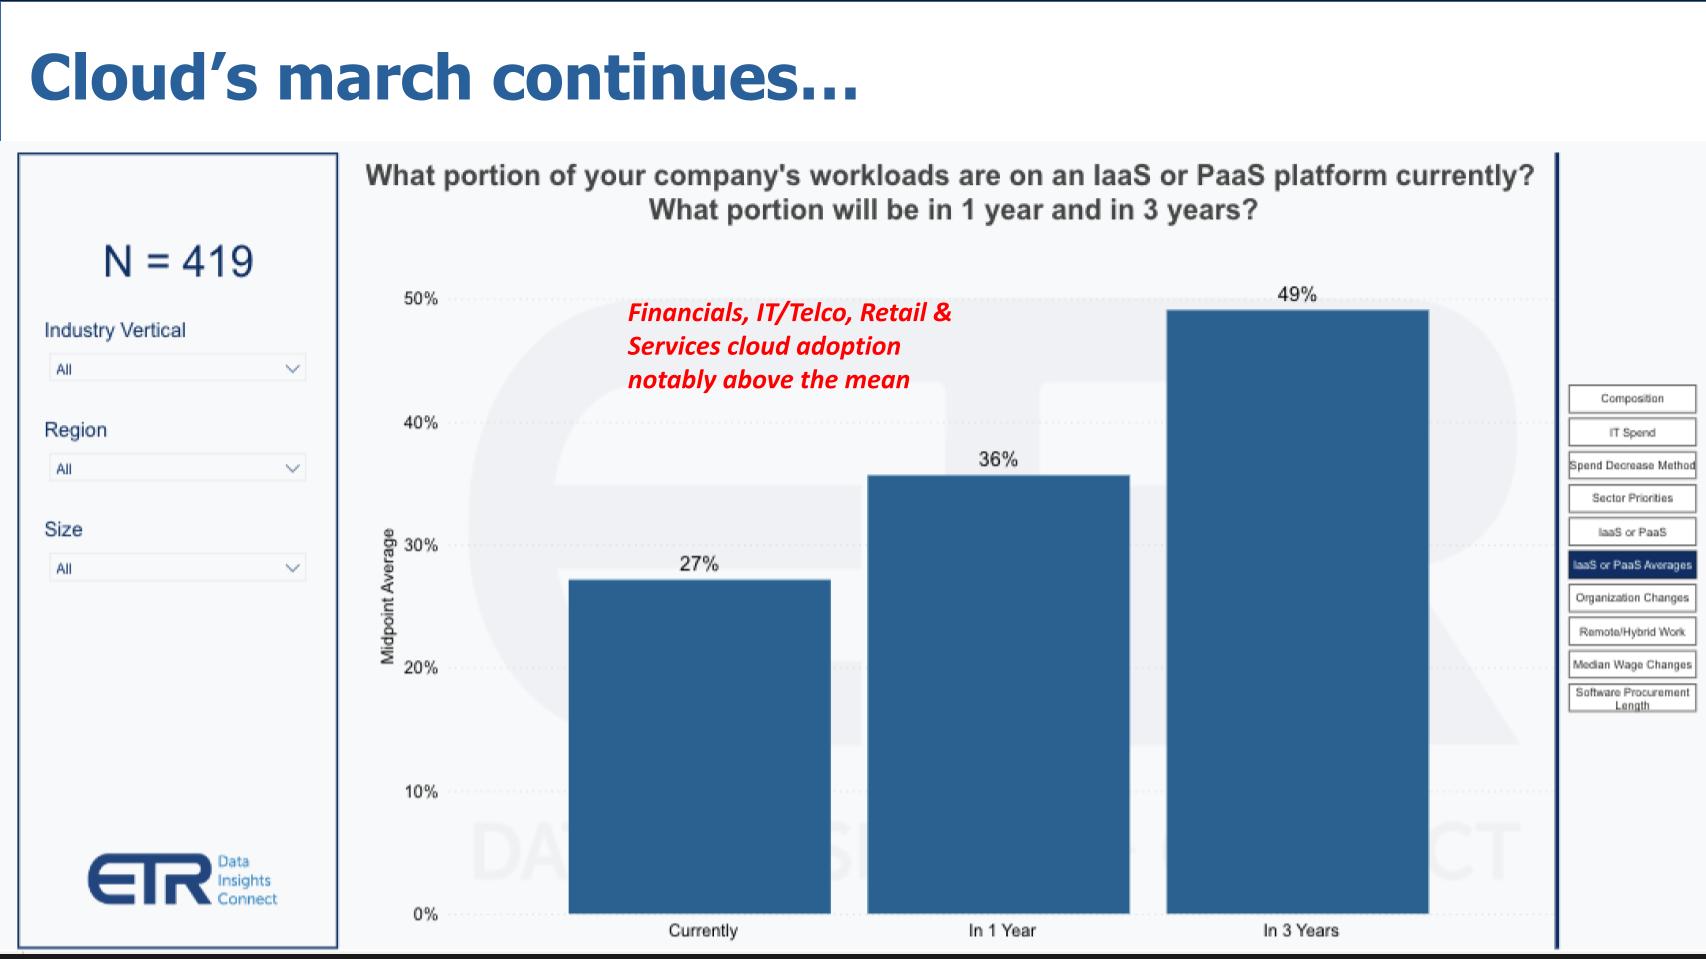
The chart above shows responses from 419 IT execs and depicts the percentage of workloads their organizations have in the cloud today and what the expectation is three years from now. As you can see, it’s at 27% today and nearly 50% in three years. Now, the nuance of the question is asked in terms of infrastructure as a service and platform as a service, which to some could include on-premises. Notably, financial services, IT/telco, retail and services industries cited expectations for the future that were well above the average adoption levels.
Regardless of how you interpret this data, there’s most certainly plenty of public cloud in the numbers. And whether you believe cloud is an operating environment or a place, there’s plenty of room for workloads to move into a cloud model well beyond mid-decade. So as ho-hum as we’ve been toward recent as-a-service models from the likes of Hewlett Packard Enterprise Co. with GreenLake and Dell Technologies Inc. with APEX, the timing of those offerings may actually be pretty good as they work toward building out what we refer to as superclouds.
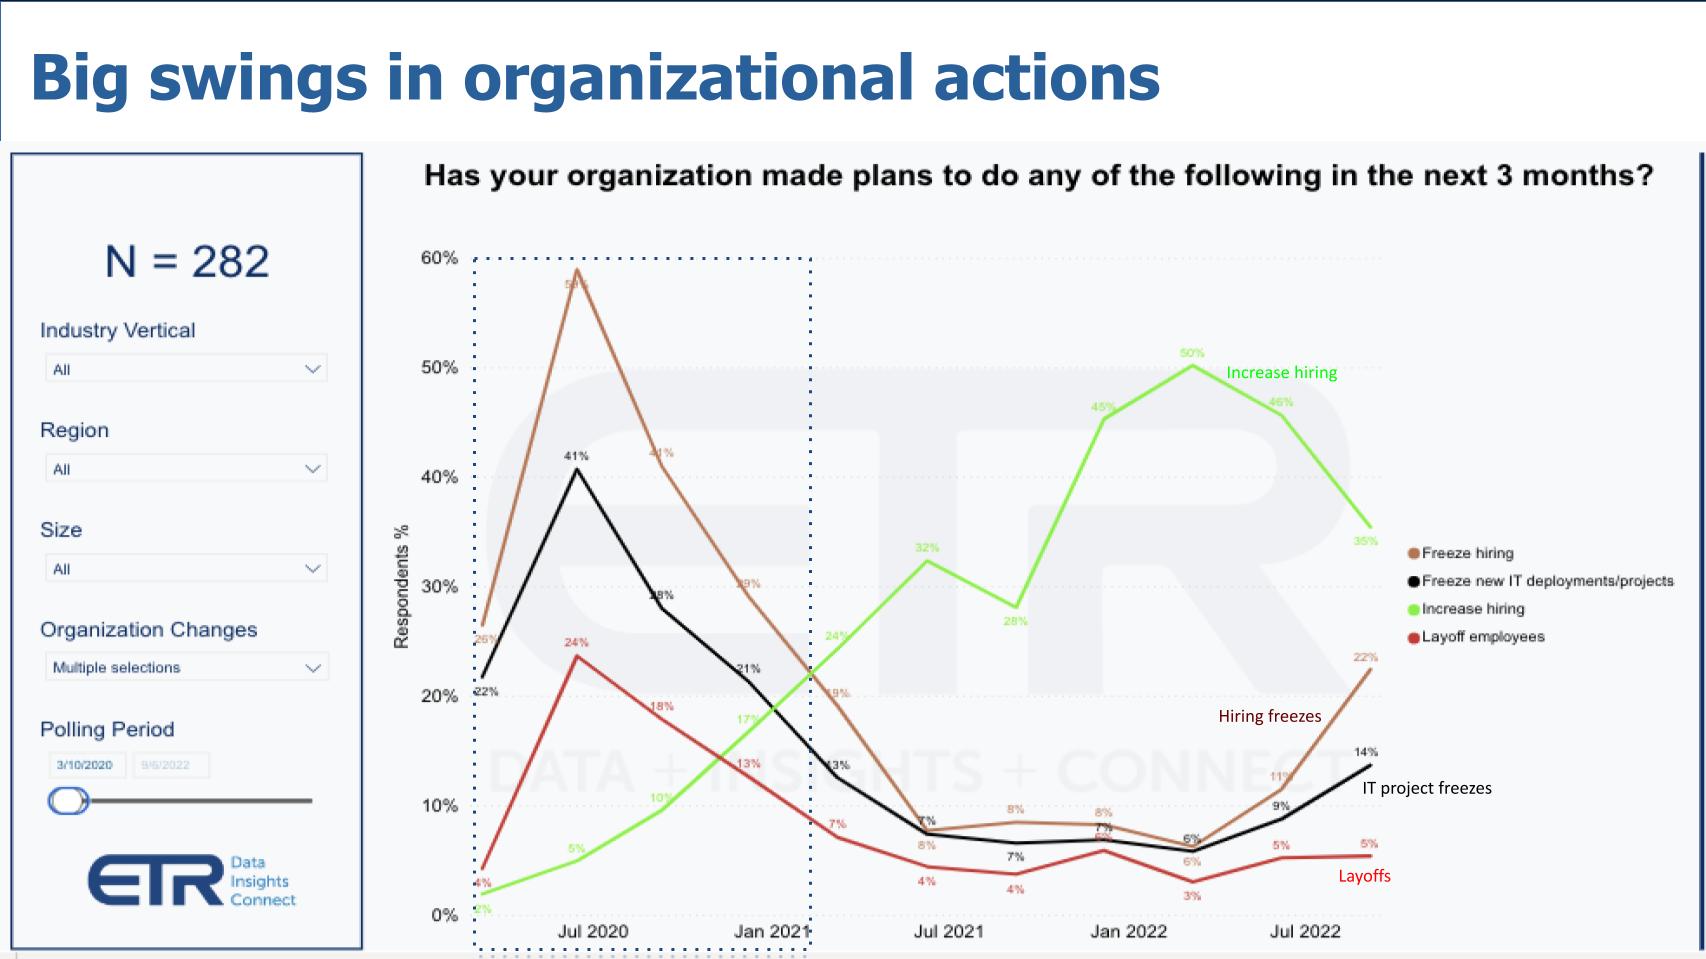
The data above shows responses from 282 IT execs on actions their organizations are taking over the next three months. The delta swings are quite dramatic. The brown line shows hiring freezes, the black line is freezing IT projects, the green line is hiring increases and the red line is layoffs.
We’ve put a box around the rough timeframe of the isolation economy and you can see the wild swings. By the middle of last summer, people were kickstarting things with more hiring. And the black line showing IT project freezes came way down and is now on the way back up. As are hiring freezes.
So we’re seeing these big swings in organizational actions, which underscores the lack of predictability. As with supply chains around the world, this is likely due to the fact that organizations before the pandemic were optimized for efficiency rather than resilience. Meaning there wasn’t a lot of fluff in the system, making it very difficult to respond to swings in demand. So the need for productivity through automation is becoming increasingly important, especially as actions that solely rely on headcount changes are very difficult to manage.
Let’s dig into which vendors have the most spending momentum on their platforms and which are facing facing possible headwinds.
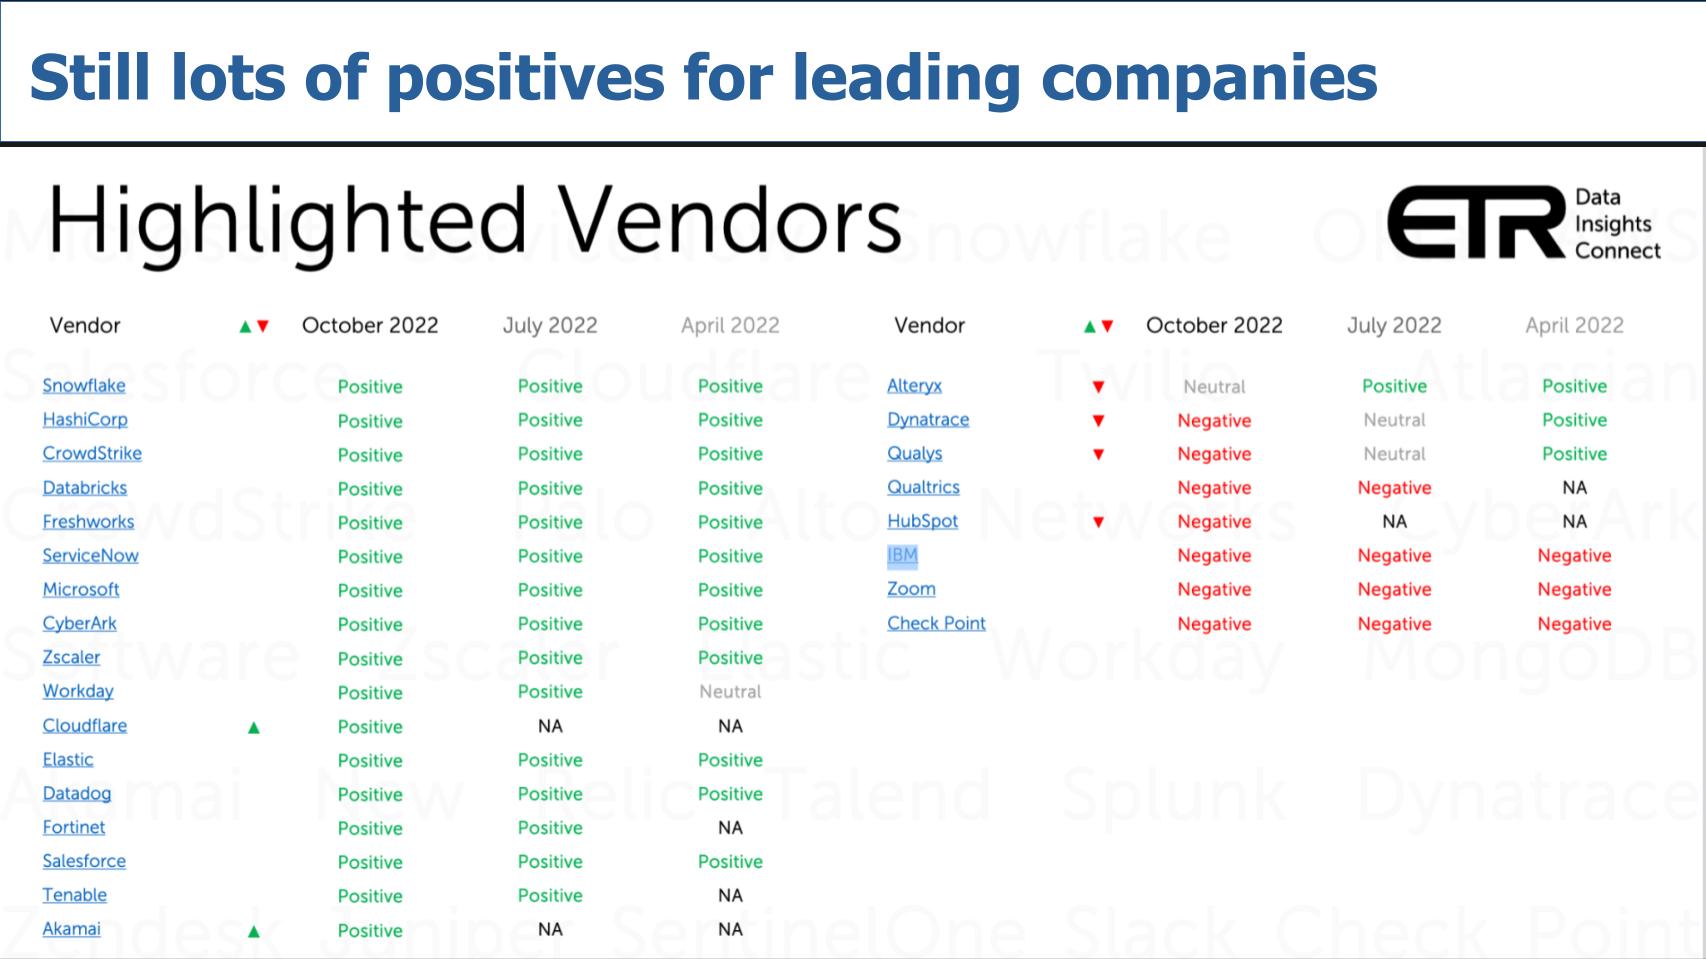
Above we show a list of companies that stand out in the survey. Snowflake Inc. once again leads the pack with a positive spending outlook. HashiCorp, CrowdStrike Holdings Inc., Databricks Inc., Freshworks Inc. and ServiceNow Inc. round out the top six. Microsoft Corp. seems always to be in the mix, as do a number of other security and related companies, including CyberArk Software Inc., Zscaler Inc., Cloudflare Inc., Elastic N.V., Datadog Inc., Fortinet Inc., Tenable Inc. and to a certain extent Akamai Technologies Inc. The other software names that are highlighted include Workday Inc. and Salesforce Inc.
On the negative side, Dynatrace Inc. saw some negatives in the latest survey, especially around its analytics business, although its security business is holding up better. Nonetheless, the company still has more customers spending less and more defections in the sample than its observability peers.
The other company in the negative side that is somewhat surprising is IBM Corp. IBM reported an outstanding quarter this past week with double-digit revenue growth, strong momentum in software, consulting, mainframes and other infrastructure like storage. It’s benefiting from the Kyndryl Holdings Inc. spinoff and the company is on track to deliver $10 billion in free cash flow this year. Meanwhile, its Red Hat crown jewel is performing well, growing in the very high teens.
So look… IBM is in the midst of a major transformation and appears to have found a groove swing. It seems like a company that is focused with hybrid cloud being powered by Red Hat and consulting. Moreover, a decade and more of artificial intelligence investments seem to finally be paying off.
The other thing we’ll add is that IBM, once an outstanding acquirer of companies, seems to be getting its act together on the M&A front. Yes, Red Hat was a big pill to swallow, but IBM has done a number of smaller acquisitions, such as Turbonomic Inc. for example, that seem to be returning dividends this year. CEO Arvind Krishna has the company focused again. He and Jim Kavanaugh, IBM’s chief financial officer, are expressing confidence on the guidance they’re giving in the company’s business. So that’s a real positive for the industry.
OK, the last thing we’d like to do is take 12 of the companies from the previous chart and plot them. These companies don’t necessarily compete with each other (some d0), but they are standouts in the survey and in the market.
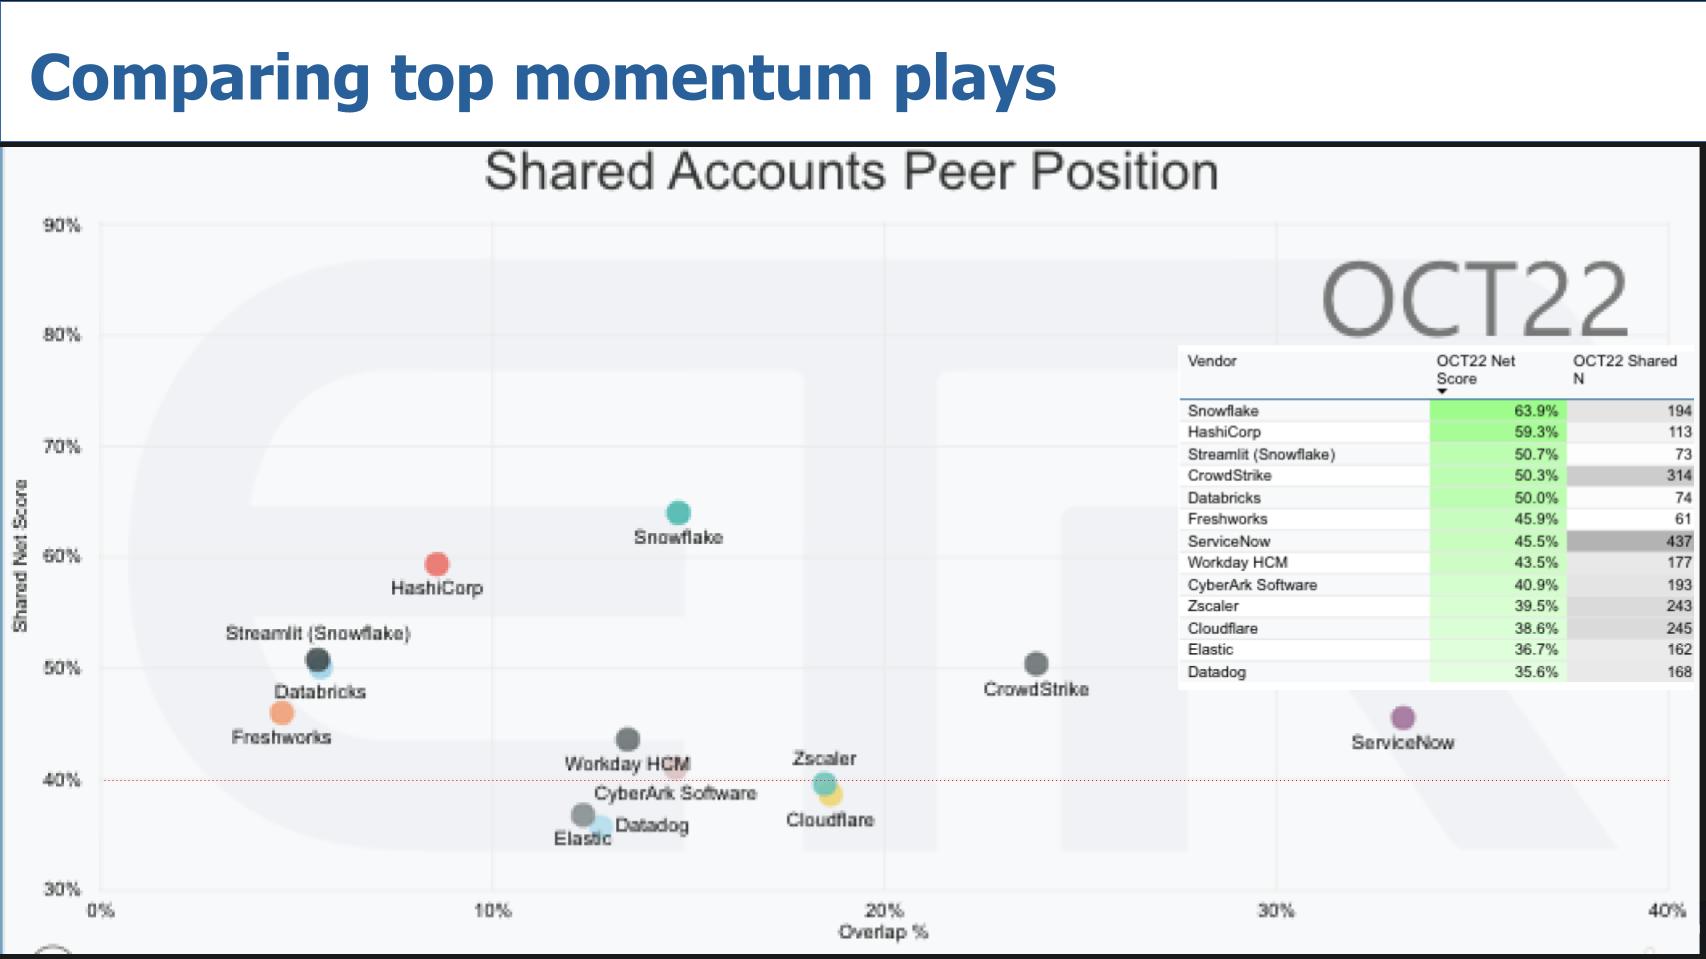
What we’re showing above is Net Score or spending velocity on the vertical axis. It’s a measure of the net percentage of customers that are spending more on a particular platform. On the horizontal axis is Overlap, which is a measure of presence in the data. We’ve inserted a table that informs how the dots are positioned. These 12 companies are all in the green in terms of Net Score and the rightmost column in the table insert is indicative of their presence in the data set. So higher is better for both columns.
Two other notes: The red dotted line at 40% indicates elevated spending momentum for a platform. And we purposely took Microsoft out of the mix because it skews the data given its size.
As we noted earlier, Snowflake once again leads with a Net Score of 64%, well above the 40% line. Now, having said that, while adoption rates remain strong for Snowflake, the company’s spending velocity in the survey has come down to earth as more customers are shifting from a growth mode – i.e. spending more with Snowflake – to more flat spending, which puts pressure on Snowflake’s Net Score. So Snowflake is by no means insulated completely from the macro factors. This is seen especially in the Fortune 500 cut of the survey for Snowflake, which shows some steeper declines in momentum. But overall it’s very impressive for the data cloud leader.
Note the position of Streamlit Inc. relative to Databricks Inc. Streamlit is an open-source Python framework for developing data apps. It’s ironic that its Net Score and N metrics are almost identical to those of Databricks — ironic because the aspirations of Snowflake and Databricks are colliding. Regardless, Databricks’ Net Score has held up well over the past year and sits in the 92nd percentile of its machine learning and AI peers within the ETR data set. Although Databricks, like Snowflake, is seeing some softness in the F500, the company has steadily moved to the right on the X axis over the last several surveys despite its inability to go public during the lockdown tech bubble.
HashiCorp is one of the few companies showing stronger a Net Score relative to last year in the ETR survey. The percentage of customers showing decreased spending or defections from HashiCorp is in the low single digits. These metrics are notable for a company with such heavy reliance on open-source technology. Significantly, Hashi’s across the board strength is even more notable amongst the largest customers in the the Global 2000 and F500. Even more impressive, ETR’s subsector data shows that Terraform, HashiCorp’s popular infrastructure as code tooling, and Vault, Hashi’s encryption management offering, have Net Scores at 75% or greater. This is rarefied territory seen recently only by the likes of Snowflake. We’ll be monitoring to see if these levels are sustainable, but at the moment, the future looks very bright for HashiCorp.
ServiceNow is impressive because it is well above the 40% mark and has 437 shared N on this graphic, the largest of any company we chose to cite. The only real negative on ServiceNow is more large customers are keeping spending levels flat. But its defections remain very low. Below 2%, in fact, within the data set. It’s interesting to see Freshworks hit the list as one of the few ITSM vendors that has momentum and can potentially take on ServiceNow.
Workday is the other big app player above the 40% line. We’re only showing Workday HCM in this graphic, which is in the 93rd percentile of its HCM peers. Workday’s financial offering is below the 40% line and saw a meaningful decline in the survey year over year.
Last month we attended Fal.Con, CrowdStrike’s user conference, and were very impressed with the company’s product vision, its execution and growing partnerships. You can see in the graphic above that the ETR survey data confirms the company’s stellar performance with a Net Score at 50%, well above the 40% mark, and more than 300 mentions, second only to ServiceNow amongst the 12 companies we’re highlighting here. Only Microsoft (not shown here) has a higher Net Score in the security space. And when it comes to presence, CrowdStrike now has caught up to Splunk Inc. in terms of pervasion in the survey.
CyberArk and Zscaler are the other two security firms that are right at that 40% red dotted line. CyberArk, for names with over 100 citations in the security sector, is only behind Microsoft and CrowdStrike in terms of spending velocity on its platform. Zscaler, for its part in the survey, is seeing strong momentum in the Fortune 500 and its pervasiveness on the X axis has been steadily increasing.
Cloudflare, Elastic and Datadog are slightly below the 40% mark but made the top 12 that we chose to highlight and continue to have positive sentiment in the survey.
So what are the big takeaways from this latest survey?
As we’ve previously reported, the tide is going out and it’s taking virtually all the tech boats out with it. But in many ways the current market is a story of heightened expectations coming down, miscalculations about the economic patterns and imperfect visibility. This led Barclays analyst Raimo Lenschow to ask the question – To Guide or Not to Guide – in a recent research note. Meaning: Should and will companies provide guidance in this uncertain market?
Indeed, when companies such as Oracle Corp. and IBM are emphatic about their near-term outlook, it gives one confidence. On the other hand, reasonable people are asking: Will the red-hot valuations that we saw over the last two years from the likes of Snowflake, CrowdStrike, MongoDB Inc., Okta Inc., Zscaler and others return? Or are we in for a long, drawn-out sideways exercise before we see sustained momentum.
Add to that uncertainty around elections and public policy, and it’s very hard to predict. Sorry to sound like a two-handed lawyer… on the one hand…. on the other….
Let’s just say, for our part, we think that once it’s clear interest rates are on their way back down and will stabilize at under 4%, and we have clarity on the direction of inflation, wages, unemployment and geopolitics, the wild swings in sentiment will subside. But when that happens is anyone’s guess. We wouldn’t be surprised if that takes 12 to 18 months, which puts us into the spring of 2024 before the valuations of 2020 and 2022 begin to show a sustained trajectory back to their lofty heights of those years.
What’s your prediction? It’s almost that time of year – let’s hear from you.
Thanks to Erik Bradley, Sanjeev Mohan, George Gilbert and David Floyer for their contributions to this Breaking Analysis. Alex Myerson and Ken Shiffman are on production, podcasts and media workflows for Breaking Analysis. Special thanks to Kristen Martin and Cheryl Knight who help us keep our community informed and get the word out, and to Rob Hof, our editor in chief at SiliconANGLE.
Remember we publish each week on Wikibon and SiliconANGLE. These episodes are all available as podcasts wherever you listen.
Email david.vellante@siliconangle.com, DM @dvellante on Twitter and comment on our LinkedIn posts.
Also, check out this ETR Tutorial we created, which explains the spending methodology in more detail. Note: ETR is a separate company from Wikibon and SiliconANGLE. If you would like to cite or republish any of the company’s data, or inquire about its services, please contact ETR at legal@etr.ai.
Here’s the full video analysis:
All statements made regarding companies or securities are strictly beliefs, points of view and opinions held by SiliconANGLE Media, Enterprise Technology Research, other guests on theCUBE and guest writers. Such statements are not recommendations by these individuals to buy, sell or hold any security. The content presented does not constitute investment advice and should not be used as the basis for any investment decision. You and only you are responsible for your investment decisions.
Disclosure: Many of the companies cited in Breaking Analysis are sponsors of theCUBE and/or clients of Wikibon. None of these firms or other companies have any editorial control over or advanced viewing of what’s published in Breaking Analysis.
Support our mission to keep content open and free by engaging with theCUBE community. Join theCUBE’s Alumni Trust Network, where technology leaders connect, share intelligence and create opportunities.
Founded by tech visionaries John Furrier and Dave Vellante, SiliconANGLE Media has built a dynamic ecosystem of industry-leading digital media brands that reach 15+ million elite tech professionals. Our new proprietary theCUBE AI Video Cloud is breaking ground in audience interaction, leveraging theCUBEai.com neural network to help technology companies make data-driven decisions and stay at the forefront of industry conversations.