


 APPS
APPS
APPS
APPS
APPS
LogicMonitor Inc., a veteran player in the application observability market, is revamping its platform today with new features, expanded integrations with key software platforms, and a fresh lick of paint to spruce up the user experience.
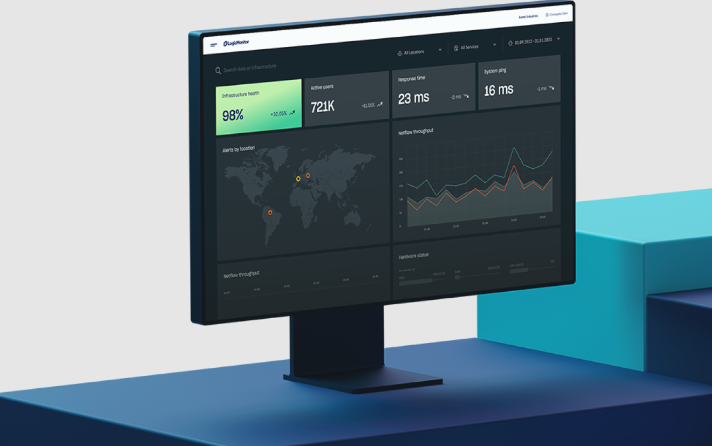
The company’s LM Envision platform provides companies with an array of tools they can use to monitor the health of their software applications and the infrastructure they run on.
Observability refers to the practice of collecting data such as application logs and other metrics that can indicate if an app has any problems and show where a fix might be needed. This data is aggregated, collated and then presented to application teams in an easy to consume dashboard where it can be explored further.
The headline update is a new event management tool called LM Dexda, which uses advanced machine learning algorithms to try and help filter through the noise caused by thousands of daily alerts. It works by prioritizing alerts so teams can move towards automating prioritized credible actions, LogicMonitor said.
Key attributes of LM Dexda include “adaptive correlation,” with alerts being automatically reclustered when a more optimal option is detected, and user-defined correlation, which enables administrators to fine-tune the underlying machine learning models to their particular needs. LM Dexda is also “ServiceNow-ready,” meaning that alerts can be enriched with ServiceNow data to provide additional context to alerts.
LogicMonitor also announced a series of new and enhanced integrations, including one for Red Hat Inc.’s Ansible platform. Jointly developed with Red Hat, the integration is said to assist with auto-remediation and auto-troubleshooting, and allows users to trigger remediation workflows directly within Ansible, acting in accordance with predefined rules.
With its improved VMware Inc. vSphere support, LM Envision now enables the discovery and monitoring of new ESXi Hosts and mission critical virtual machines, while the Cisco Meraki and Catalyst SD-Wan integrations are brand new, making it simpler for customers to monitor Cisco Systems Inc.-based environments. LogicMonitor is also delivering improved monitoring for Kubernetes deployments, with greater coverage and deeper visibility into the cloud environments that host it.
The new Datapoint Analysis features, meanwhile, rely on machine learning algorithms to surface related metrics and patterns across different infrastructure resources, helping expedite issue diagnosis and reduce the mean-time-to-resolution.
Finally, LogicMonitor is changing the look and feel of its platform to create a more unified and consistent experience for users, saying this can aid in reducing the complexity of observability operations. Its user interface has been optimized to present information from complex, hybrid environments in a more intuitive way, the company said, with consistency across devices, services and networks.
It’s also adding new components such as “bulk actions,” enabling teams to do more tasks at once, plus better search and filtering capabilities. In addition, it’s debuting 20 new, out-of-the-box dashboards for Amazon Web Services and Microsoft Azure, providing service-specific views to give users more insights into health, performance and availability, the company said.
Announcing today’s updates, LogicMonitor Chief Executive Christina Kosmowski said they address the reality that businesses are coming under tremendous pressure to deliver exceptional digital experiences to their users. “To efficiently do that, our customers look to us to contextualize the overwhelming amount of data within their complex IT environments,” she said.
Support our mission to keep content open and free by engaging with theCUBE community. Join theCUBE’s Alumni Trust Network, where technology leaders connect, share intelligence and create opportunities.
Founded by tech visionaries John Furrier and Dave Vellante, SiliconANGLE Media has built a dynamic ecosystem of industry-leading digital media brands that reach 15+ million elite tech professionals. Our new proprietary theCUBE AI Video Cloud is breaking ground in audience interaction, leveraging theCUBEai.com neural network to help technology companies make data-driven decisions and stay at the forefront of industry conversations.