


 INFRA
INFRA
INFRA
INFRA
INFRA
As the coronavirus pandemic grinds on, information technology spending is now projected to decline by 5% in 2020.
That’s according to the latest survey data and analysis by Enterprise Technology Research. Although the drop represents a 900-basis-point swing from 4% consensus growth entering 2020, tech spending remains bifurcated, with some suppliers and sectors showing significantly stronger spending momentum than others.
In this Breaking Analysis, we bring in Sagar Kadakia, ETR’s director of research, to examine the following:
As we’ve reported previously, the chart below shows the declining sentiment over the course of the latest survey, which took place at the height of understanding the coronavirus impact in the U.S. The survey includes the responses of 1,200-plus CIOs and IT professionals. Note that ETR conducted event analysis after each cited milestone to measure the declining sentiment.
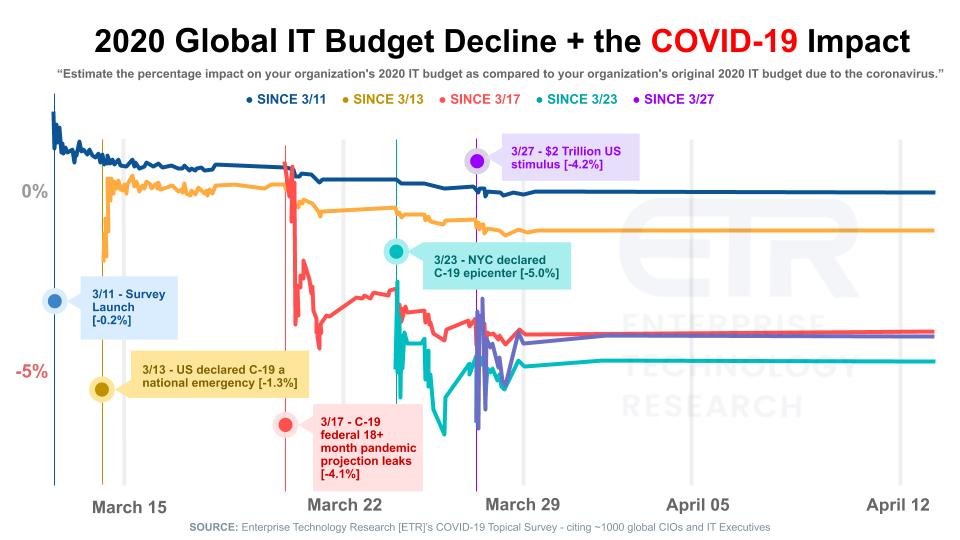
The key point here is that if you isolate on the more recent survey responses, taking into account the more recent sentiment, the data suggests that a 5% decline is the most likely scenario at this time — understanding that this is a fluid situation we will be updating regularly throughout the year.
Here’s ETR’s Kadakia explaining this data in more detail:
The chart below shows the relative impact of COVID-19 on spending by some of the hardest-hit industries. The x axis depicts the Net Score (spend velocity) relative to the survey three months ago (S/S Delta) – so it’s really reflecting change in sentiment from early first quarter 2020. The y axis shows Net Score from 12 months ago (Y/Y Delta).
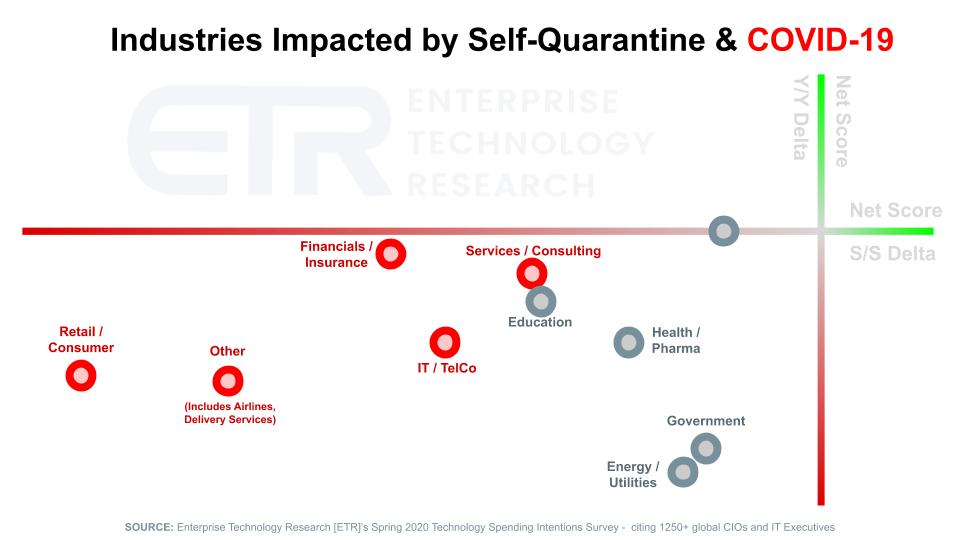
Across the board in these sectors we’re seeing declines in spending sentiment. Some points on this graphic:
Here’s Sagar Kadakia’s take on the industry outlook:
The chart below shows Net Score or spending momentum in the security sector. The data compares the most recent April survey results (yellow bar) with April ‘19 (gray bar) and the Jan survey (blue bar).
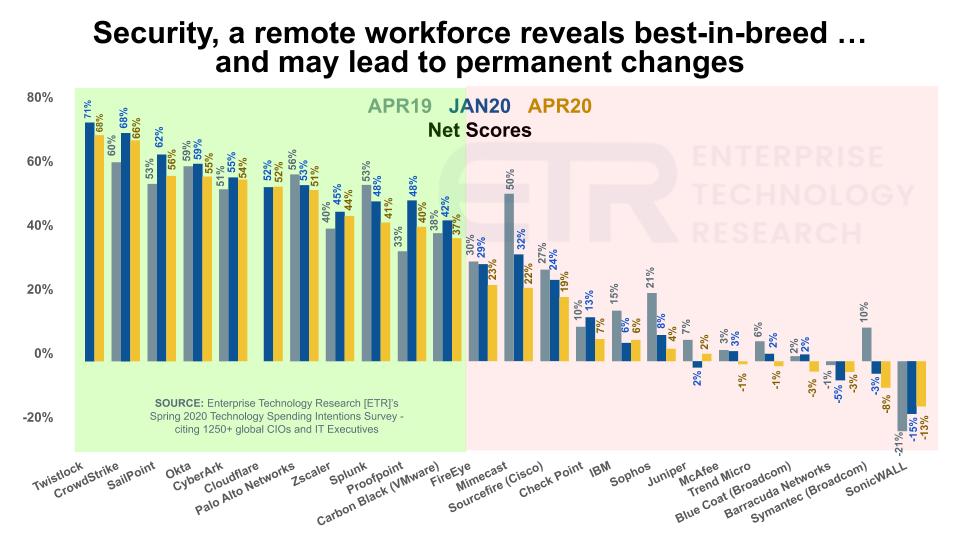
Although almost all suppliers show declines from January results, many are showing accelerated momentum from a year ago, including Twistlock (Palo Alto Networks), Crowdstrike, Sailpoint, Okta and others. As we’ve stressed, the playing field is bifurcated: Those companies positioned well for cloud, SaaS, remote workers and mobile security tend to have strong momentum, while others are seeing decelerating spend velocity.
Sagar Kadakia adds color in this video clip:
In 2008/2009, we reported that we were entering the next phase of cloud computing. Whereas early cloud was about startups and tire kickers, the 2008 downturn saw CFOs embrace a rapid shift from capital expenses to operating expenses. When we came out of the financial crisis, organizations realized the power of cloud computing and cloud’s decade-long bull march began.
We believe the end is nowhere near as organizations dabbling in digital transformation and cloud-first mantras now see cloud as a mandate to business flexibility.
The slide below shows Net Scores or spending velocity for the Big Three cloud players:
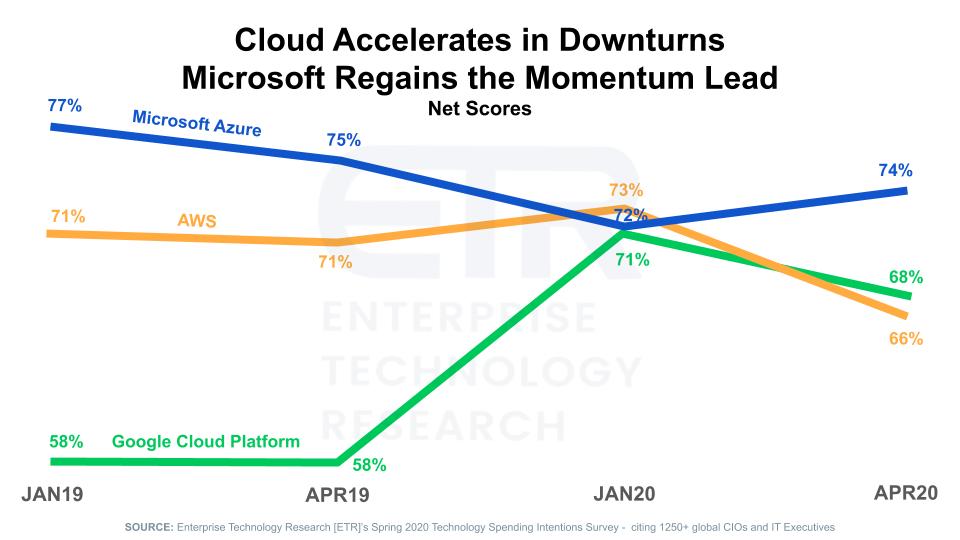
Key points:
As Sagar Kadakia says, “Cloud is a three-horse race”:
We’ll see over time how this plays out. As we’ve pointed out many times, the AWS market numbers are clean and easier to track. But the strong momentum in the surveys for Microsoft is undeniable.
The world has reported on Zoom Video Communications Inc.’s ascendency and in previous Breaking Analysis segments we’ve commented on the tailwind that work from home has given this space. But as shown in the data below, it’s not all good for all vendors – again the bifurcation story.
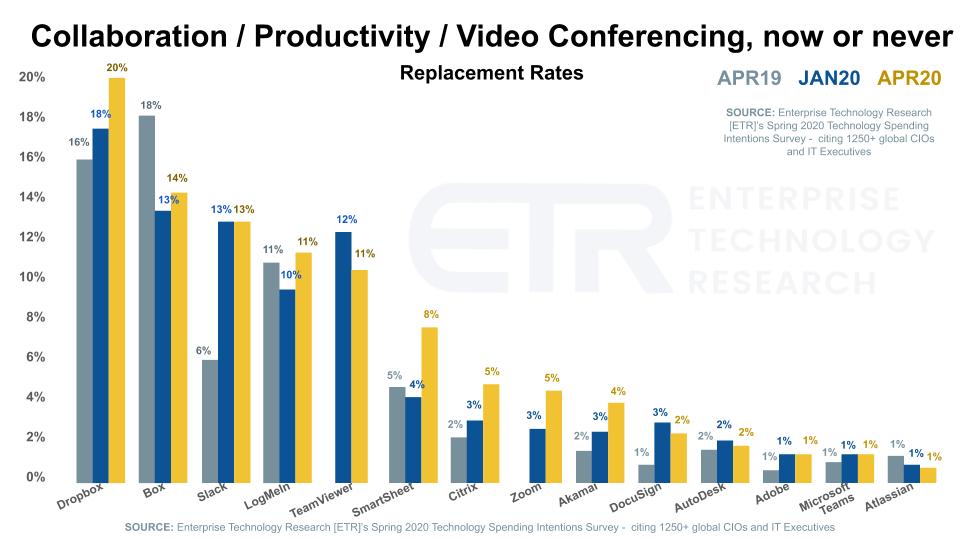
This chart compares a mix of productivity and collaboration players. It shows the three survey samples we mentioned earlier but it focuses on replacement rates for the vendors. Note that many are seeing double-digit defections from their platforms – one in five for Dropbox – while the rightmost players are looking strong.
As Sagar Kadakia points out in this clip, if you’re not doing well now with the work-from-home pivot, it could spell trouble. Note that the three vendors showing the top defection rates — Dropbox, Box and Slack — currently have a combined $25 billion market cap.
Collaboration is another area where Microsoft is winning with Teams. The chart below focuses on the Fortune 500 and asks what percentage of your organization is using Teams today and what’s the outlook twelve months from now.
This chart compares a mix of productivity and collaboration players. It shows the three survey samples we mentioned earlier but it focuses on replacement rates for the vendors. Note that many are seeing double digit defections from their platforms – one in five for Dropbox – while the rightmost players are looking strong.
As Sagar Kadakia points out in this clip, if you’re not doing well now with the work from home pivot it could spell trouble. Note that the three vendors showing the top defection rates, Dropbox, Box and Slack currently have a combined $25B market cap.
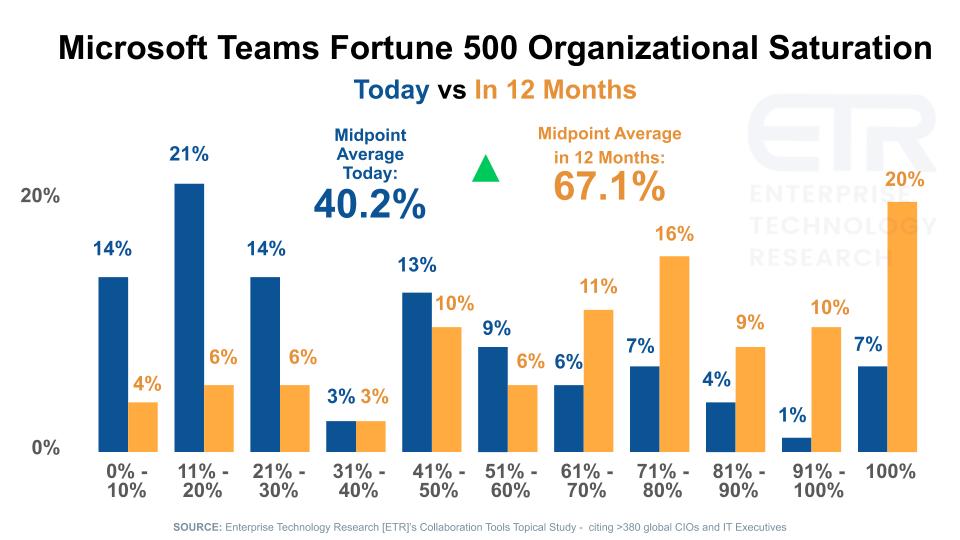
The following key points are noteworthy:
Sagar Kadakia explains further:
The chart below shows the same view as the previous Teams drill-down with a focus on Slack.
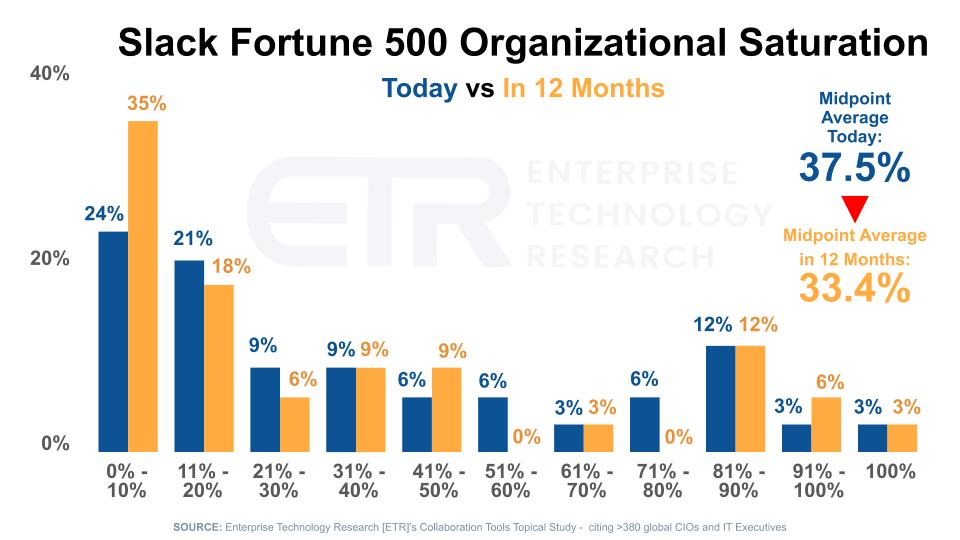
Key points in the data:
As Sagar Kadakia points out, Slack is a seat-based model and fewer users means less revenue, which spells potential trouble ahead for Slack.
CIOs in hard-hit industries tell us that they’ve brought spending to a halt on most large projects. They say some strategic digital transformation projects will continue but an obvious place for companies in hospitality, airlines, retail, healthcare, restaurants and other hard-hit businesses is to put the brakes on project work.
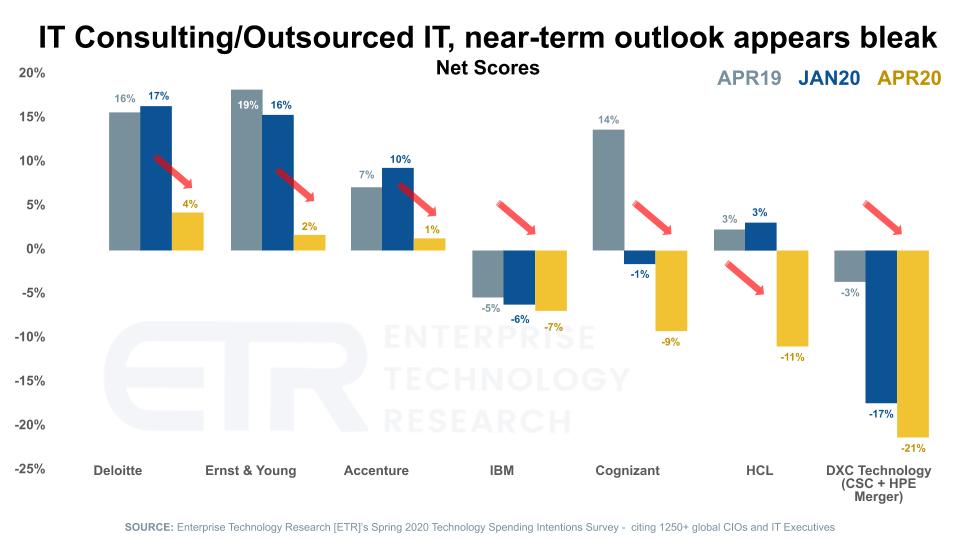
The above data shows Net Scores or spending momentum for seven large SIs and consultancies. Note the yellow bar comparing the most current survey data with three months ago (blue) and last April (gray). Notably, IT consulting looked strong entering the year for Deloitte, EY and Accenture, but virtually all consultancies are showing dramatic declines in spending momentum in the most recent survey.
Key Points:
Watch and listen to Sagar Kadakia’s commentary on this topic:
IBM reported that Red Hat revenues grew 20% in the first quarter of this year. That’s pretty healthy, but the forward-looking data in the ETR surveys suggest there’s a slowdown coming.
Around 60% of IBM’s revenue comes from professional services. As we reported last year when IBM completed its Red Hat acquisition, the near-term priority for IBM was to drive OpenShift deals through IBM’s consulting and services organization as a platform to modernize a substantial number of applications in the IBM customer base.
The good news for IBM is that it has hit its goal of making Red Hat accretive to free cash flow in its first year under IBM. We’ve always been confident that this would happen given IBM’s visibility on its modernization pipeline and its services prowess.
But IBM, like many companies, has suspended earnings guidance because of lack of clear visibility on its earnings. In its latest earnings call, Chief Financial Officer Jim Kavanaugh stressed that IBM’s services business is substantially annuitized – more than 80% for IBM Global Business Services (strategy consulting, application integration and management services) and 95%+ for Global Technology Services (outsourcing and infrastructure support services). But each quarter, this percentage comes down.
When asked about key indicators IBM is watching, Kavanaugh said:
Arvind and I are looking at daily… what’s happening to the rate and consumption of our backlog, what are clients doing around projects, around offerings, what’s happening to our utilization, our chargeable billable rates, our price realization. Each of those are fundamental KPIs that we’re looking at in this environment right now, to the health of the indicator around a services based business.
IBM understands that the near-term health of its business, including its ability to meet its second Red Hat financial goal – that is, make Red Hat accretive in year two – is heavily tied to its services performance and these metrics.
Longer-term, as we’ve reported previously, Chief Executive Arvind Krishna wants to return IBM to growth and he plans to do that, in part, with more of a technology-led story.
We’re watching this closely. It could be a rocky few months or quarters for IBM. The upshot is Krishna will get a “COVID Mulligan” and have some breathing room to rebound.
We’ll continue digging into the survey data and plan to focus on infrastructure, analytics data stores, software, automation (such as robotic process automation) and other sectors, so please tune in for that. Remember these episodes are all available as podcasts wherever you listen.
Ways to get in touch: Email david.vellante@siliconangle.com, DM @dvellante on Twitter and comment on our LinkedIn posts.
Also, check out this ETR Tutorial we created, which explains the spending methodology in more detail.
Here’s this week’s full video analysis:
Support our mission to keep content open and free by engaging with theCUBE community. Join theCUBE’s Alumni Trust Network, where technology leaders connect, share intelligence and create opportunities.
Founded by tech visionaries John Furrier and Dave Vellante, SiliconANGLE Media has built a dynamic ecosystem of industry-leading digital media brands that reach 15+ million elite tech professionals. Our new proprietary theCUBE AI Video Cloud is breaking ground in audience interaction, leveraging theCUBEai.com neural network to help technology companies make data-driven decisions and stay at the forefront of industry conversations.