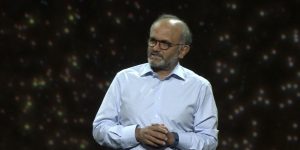


 In his “Data Visualization for Social Change” South X Southwest talk, Mapping Worlds director, Desmond Spruijt, founder and director of Mapping Worlds states: “The power of data visualization as a tool for social change can no longer be ignored. Successfully illustrating vital data can help advocates maximize the impact of sound science in public debate and policy.” Over the last eight years Spruijt has directed project teams to design and develop data interfaces for several international organizations and knowledge institutes including the IMF, United Nations and the Agricultural Science and Technology Indicators (ASTI) initiative.
In this interview, we discuss social change initiatives and strategies and tools that socially conscious data scientists like Spruijt use to bring it about.
What is so special about what data visualization has to offer social change efforts?
Social change to me is all about removing obstacles for everyone to participate in society, worldwide. Discrimination, illiteracy, corruption, these are examples to be countered with policy and laws. To establish enduring changes you will need awareness to start with, combined with solid information. This is where data visualization can contribute.
Naked data are revealing. Social change efforts often have to deal with misconceptions about size, proportion or impact. Visualization is a strong way to clarify what the data proves.
Can you give an example of a popular belief, which upon further inspection, was contradicted through data visualization?
 People tend to only pay attention to what’s close to them. Data visualization is a great way to hold up a mirror, to expand the perspective. For example, the Netherlands, where I am based, receives asylum seekers and refugees. The popular belief is that their numbers are too large. So, many people believe the government should favor asylum in asylum seekers’ region of origin. But, if you map the numbers worldwide, simply with proportional circles, the African and Middle Eastern circles are enormous. The European ones are tiny, much smaller than people imagine.
You’ve said that while narration is important, ensuring the integrity of data “is of primary concern.” What strategies do you use to make sure your data analysis is trustworthy?
For each dataset I try to find the right combination of visualization qualities, like
comparison, contrast, hierarchy and sequence and avoid the pitfalls. In data
visualization it’s the impression of the presented data in particular that needs to be
trustworthy. Visualization can easily emphasize the wrong things or create false
impressions.
I make sure the interface displays the data in an objective way. I don’t want to show dramatic growth if in reality there is only a minor change.
Organizations like the IMF and UNAIDS have lauded your work, particularly your attentiveness to their revision requests. Is there anything in particular you have to take into account when developing visualization tools for such organizations?
IMF, UNAIDS and institutes like these are the source of authoritative data, validated by their entire organizational framework. A lot of people depend on the data for their own research and decisions. In Mapping Worlds’ tools I take care to fold in all formal and data related requirements, while still designing a user orientated interface.
UNAIDS for example has high quality, worldwide data about HIV and treatment. We
developed rich charts to portray these data, with detailed hover display on every
element. But for some datasets UNAIDS works with estimate ranges. We introduced
a combination of a discrete value driving the chart, a bandwidth to show the estimate
range and we forced to the hover label and excel output to show just the estimate range.
We always end with: How would you like to see the field of data science evolve over the next few years?
The trend I see is that journalists and people like me are directing their work
to areas where data are made available (open data). A lot of issues in society on the other hand have no data readily available, or none at all. These issues tend to remain in the shadow now. I hope data science finds ways to also enter these areas.
Support our mission to keep content open and free by engaging with theCUBE community. Join theCUBE’s Alumni Trust Network, where technology leaders connect, share intelligence and create opportunities.
Founded by tech visionaries John Furrier and Dave Vellante, SiliconANGLE Media has built a dynamic ecosystem of industry-leading digital media brands that reach 15+ million elite tech professionals. Our new proprietary theCUBE AI Video Cloud is breaking ground in audience interaction, leveraging theCUBEai.com neural network to help technology companies make data-driven decisions and stay at the forefront of industry conversations.