

 BIG DATA
BIG DATA
BIG DATA
BIG DATA
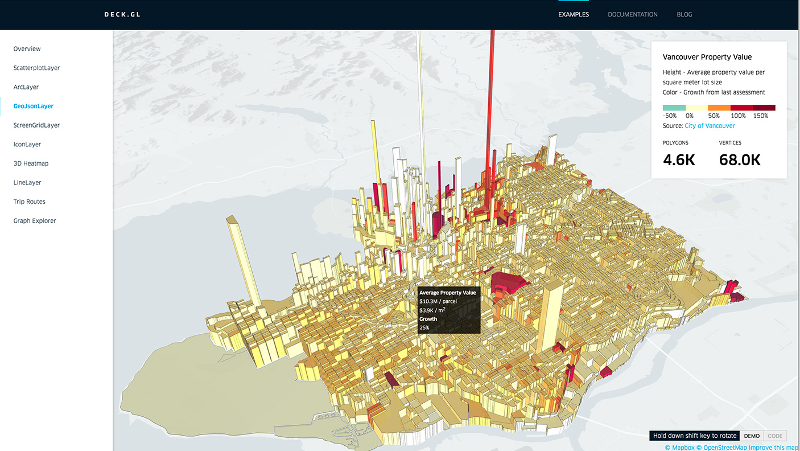
Like other top tech companies, Uber Technologies Inc. often creates custom software tools for its staff when the products available on the market don’t fully fit the bill. One of the ride-hailing giant’s most notable projects is a data visualization tool called deck.lg that became accessible to the public last year and has received a major update today.
Nicolas Garcia Belmonte, the head of the team behind the system, detailed the changes in a post on the Uber Engineering blog. The biggest improvement is that the core visualization features in deck.lg 4.0 are decoupled from the default interface, which was created to help the company’s employees examine location data related to its service. The result is that the tool can now support a variety other use cases besides analyzing driving patterns, traffic congestion and other information that needs to be imposed on a map.
According to Garcia Belmonte, Uber has already put the new version to the test by harnessing deck.lg to visualize its internal machine learning projects. Artificial intelligence is so complex that fully understanding how an algorithm interprets images or associates different words can be almost impossible without a graphical representation. For this reason, Google Inc. recently open-sourced a modeling tool specifically designed to help development teams gain better visibility into their AI projects.
Another area where Uber has applied deck.lg 4.0 is network diagnostics. Similarly to machine learning applications, data center infrastructure generates a tremendous amount of information that can be difficult to understand in its raw form.
The augmented visualization capabilities in the new release are joined by a revamped documentation library that aims to ease the learning process. When a user is testing out one of the sample graphs that Uber has included in deck.lg, they can now pull up the relevant explainer using a simple mouse drag. The tool currently features 10 examples that include visualizations of car and vehicle traffic in major metropolitan areas well as more abstract models designed to provide a foundation for new projects.
The code for deck.lg is available on Uber’s GitHub page.
Support our mission to keep content open and free by engaging with theCUBE community. Join theCUBE’s Alumni Trust Network, where technology leaders connect, share intelligence and create opportunities.
Founded by tech visionaries John Furrier and Dave Vellante, SiliconANGLE Media has built a dynamic ecosystem of industry-leading digital media brands that reach 15+ million elite tech professionals. Our new proprietary theCUBE AI Video Cloud is breaking ground in audience interaction, leveraging theCUBEai.com neural network to help technology companies make data-driven decisions and stay at the forefront of industry conversations.