 BIG DATA
 BIG DATA
 BIG DATA
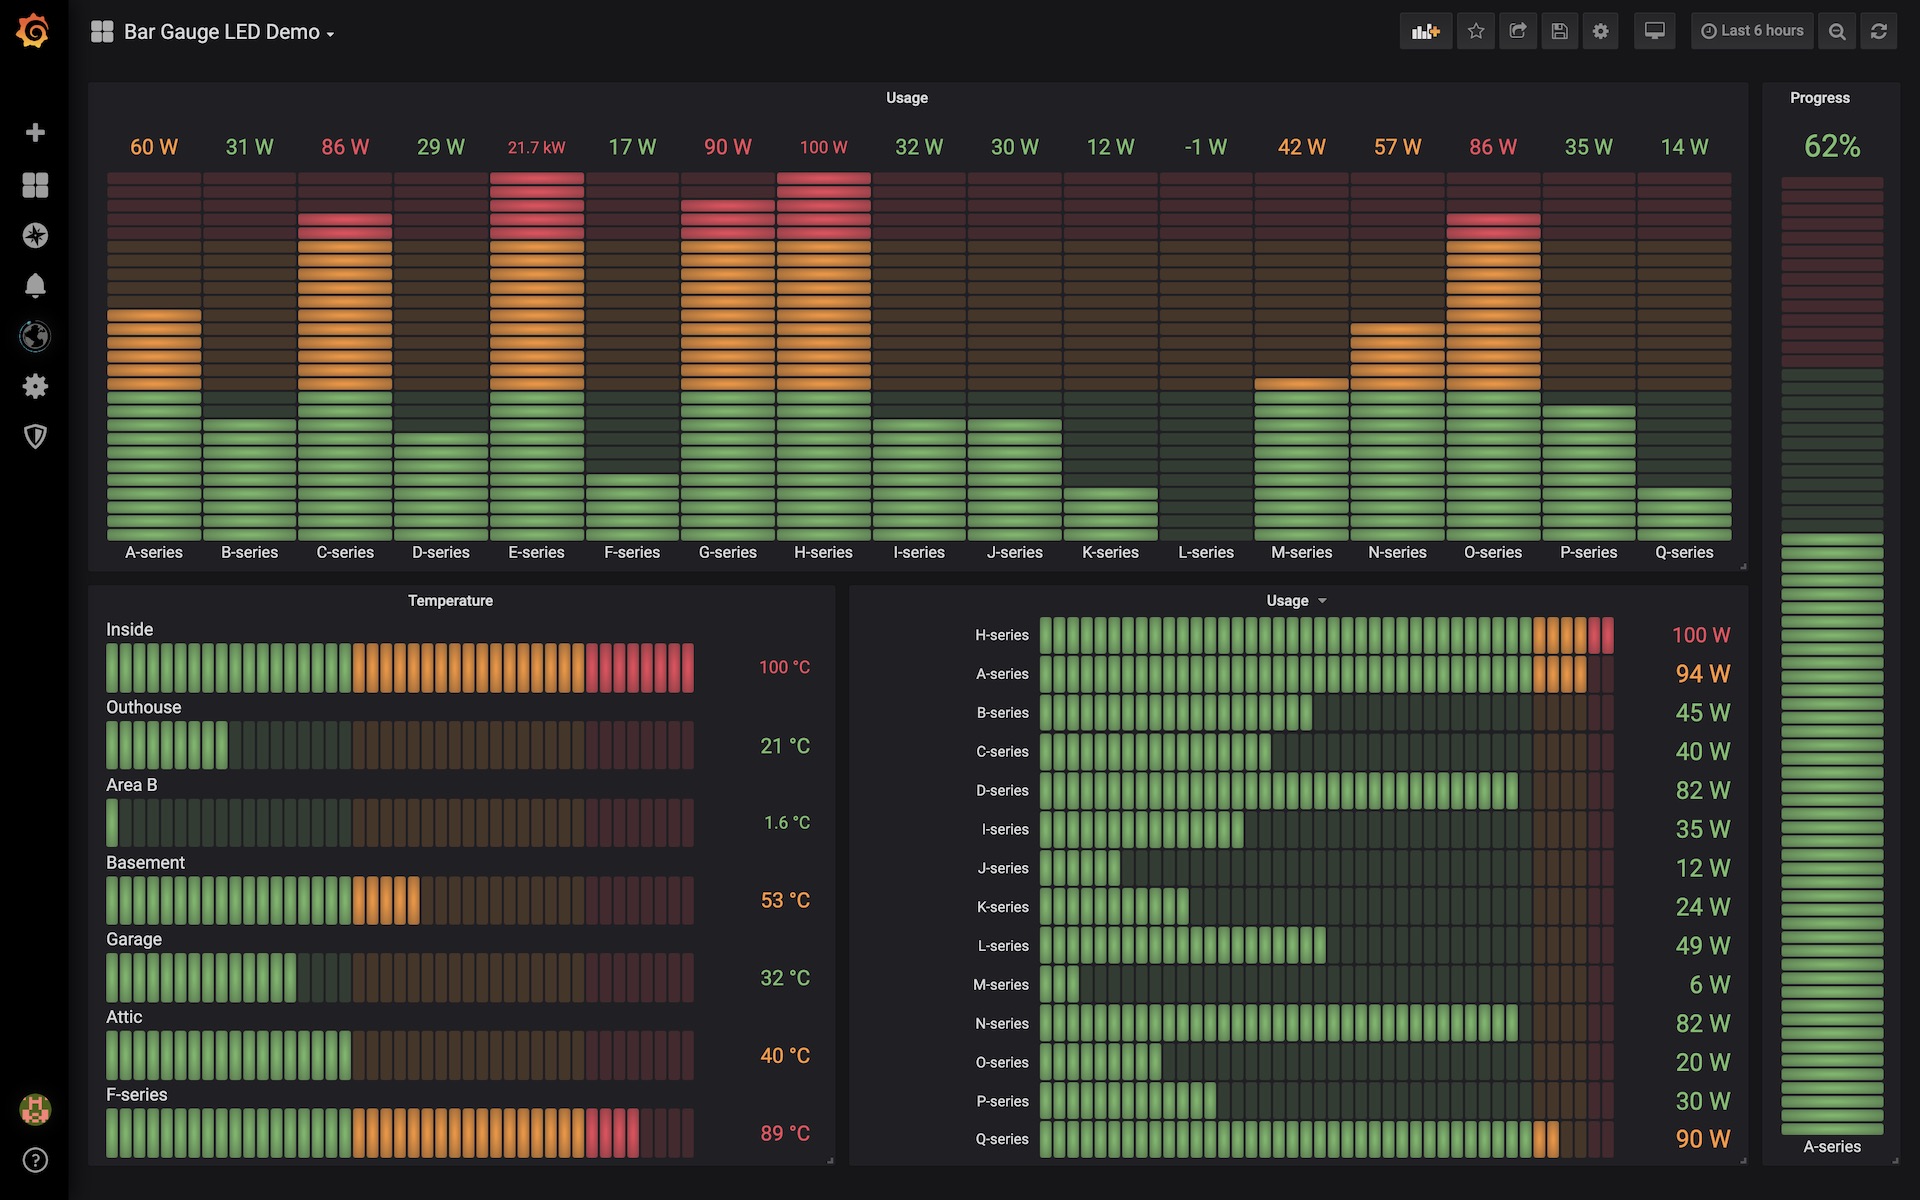
Raintank Inc.’s Grafana Labs, which is the lead developer of the Grafana and Loki open-source projects used to visualize time series data, today announced the general availability of Grafana 7.0 with faster visualizations and features to simplify the development of custom plugins.
The platform is based upon the open-source Grafana query and visualization project, which boasts more than 500,000 active installations and millions of dashboards in use. Grafana calls its product an “observability” platform, meaning that it goes beyond log monitoring to include active alerting, visualization, distributed systems tracing and log aggregation and analytics.
Version 7 completes Grafana’s evolution into a full-scale observability platform by adding support for tracing, a function used in application performance monitoring which is “one of the three pillars of observability,” said CEO Raj Dutt. “It allows you to see a transaction end to end from the [application program interface] call down to the request level.”
Unlike competitors Datadog Inc., Elasticsearch Global BV and Splunk Inc., which require their own data stores, Grafana is database-agnostic, Dutt said. “You’re often limited by what individual databases can do if you want to combine or massage data mathematically,” he said.
Grafana requires no database for integrating data. In the new version, “you can transform the data, do math on it like getting an average or finding a maximum value that you would normally have to do that in the database,” he said. “Now you can do that in Grafana with no code to write.”
A shared set of common data operations that were previously duplicated as custom features in various panels or data sources are now an integral part of the Grafana data processing pipeline and can be used by all data sources and panels, the company said. Transformations can include renaming, summarizing, combining and performing calculations from different panels. A new data inspection feature lets users see, export and perform simple transformations on the underlying source data for a panel.
Also new in this release is an overhauled plugin framework that Dutt said makes it much easier for third-party developers to build extensions. “Before, the plugin framework was kind of a blank canvas where you had to build from scratch,” he said. “We now have libraries that you can use to make developing plugins easier. A plugin that used to take 700 lines to write can now take 100″ and can be written in any language.
A new Amazon Web Services Inc. CloudWatch Logs plugin adds to existing plugins that work with Google LLC’s Google Cloud Platform Operations Suite and Microsoft Corp.’s Azure Monitor as well as the open-source Loki tracing inputs and Zipkin and Jaeger distributed tracing projects. Other plugins are also available to read source data ServiceNow Inc., Splunk Inc., Datadog, New Relic Inc., Zabbix LLC and Oracle Corp. as well as the open source Prometheus, Graphite and Elasticsearch sources.
Grafana raised $24 million last October, money it technically didn’t need because it was already operating on a break-even basis. Dutt said business has continued to be strong during the COVID-19 pandemic. “The company has almost doubled its size to 140 people operating across 25 countries over the past year and “had our best quarter ever February through April,” he said.
Grafana Cloud Standard pricing starts and $49 per user per month, with pro and enterprise versions custom-quoted.
Support our mission to keep content open and free by engaging with theCUBE community. Join theCUBE’s Alumni Trust Network, where technology leaders connect, share intelligence and create opportunities.
Founded by tech visionaries John Furrier and Dave Vellante, SiliconANGLE Media has built a dynamic ecosystem of industry-leading digital media brands that reach 15+ million elite tech professionals. Our new proprietary theCUBE AI Video Cloud is breaking ground in audience interaction, leveraging theCUBEai.com neural network to help technology companies make data-driven decisions and stay at the forefront of industry conversations.